COVID-19 & Hawaii’s Economy
With expiration of Hawaii’s Safe Travel program on March 25, 2022, this DBEDT COVID information webpage will not be updated. Final update of this page was done on March 24, 2022.
To monitor Hawaii’s economic conditions during the COVID-19 outbreak, DBEDT put together this dashboard to compile the most recent economic data. Readers can go to each section to see more detailed and historical data.
DBEDT has produced a brief report on how the pandemic has affected the labor market in Hawaii:
Hawaii’s Labor Market Impact During COVID-19 ![]()
DBEDT has produced a report on the economically vulnerable populations in Hawaii:
COVID-19 and the Economically Vulnerable Populations in Hawaii ![]()
Additionally, in response to the COVID-19 pandemic, the U.S. Census Bureau has created two experimental, short-term surveys to help evaluate the effects of business closures and stay-at-home orders in the United States.
Click here to see the results from the Business and Household Pulse Survey for Hawaii.
Weekly Economic Dashboard
DBEDT/READ has created a dashboard to track COVID-19 cases and economic activities at the county level. The dashboard is updated weekly and is available every Friday.
Click here for previous dashboards
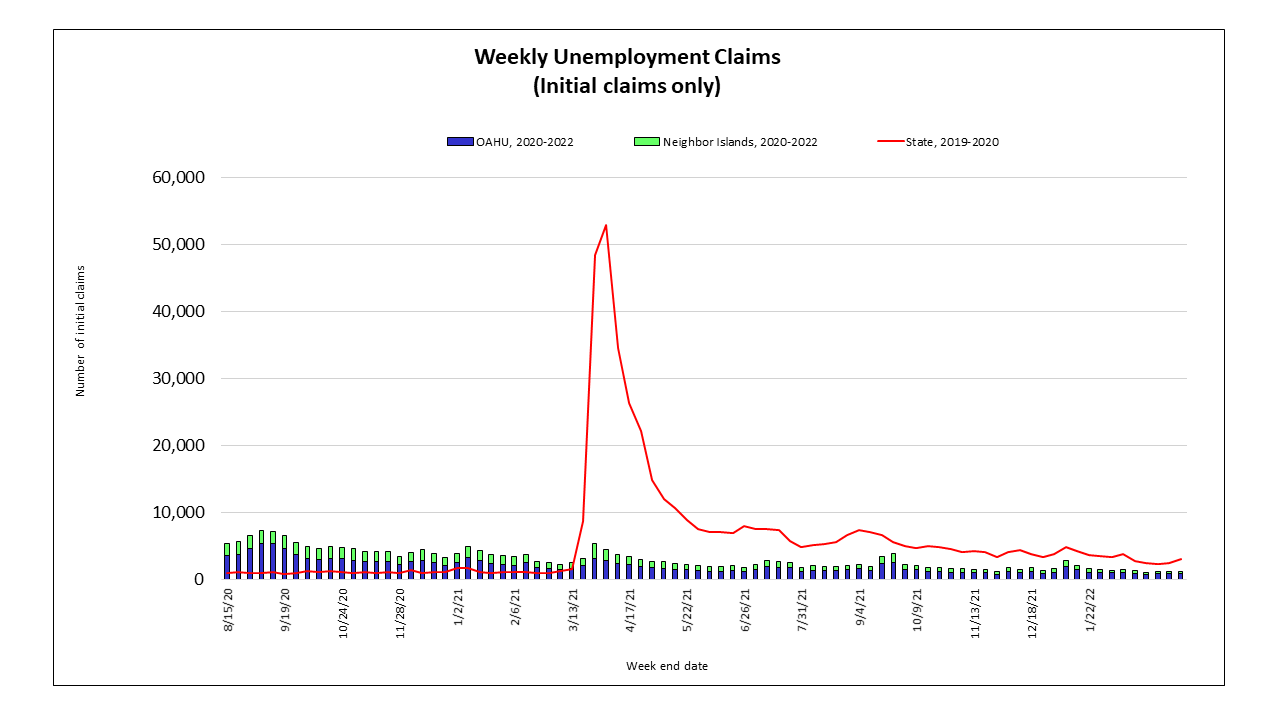
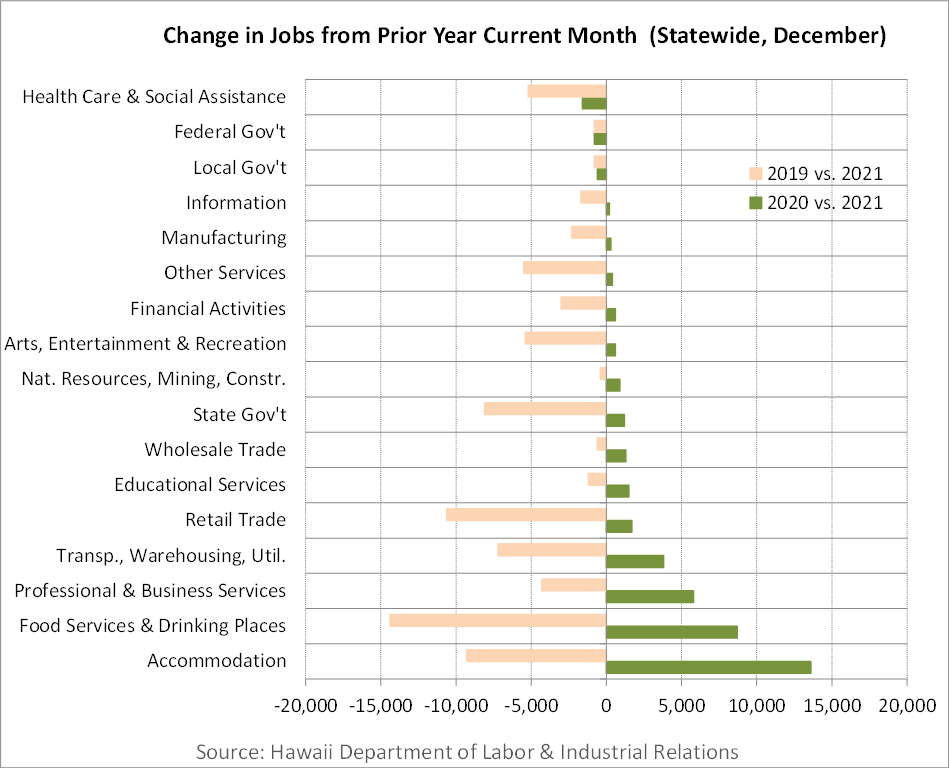
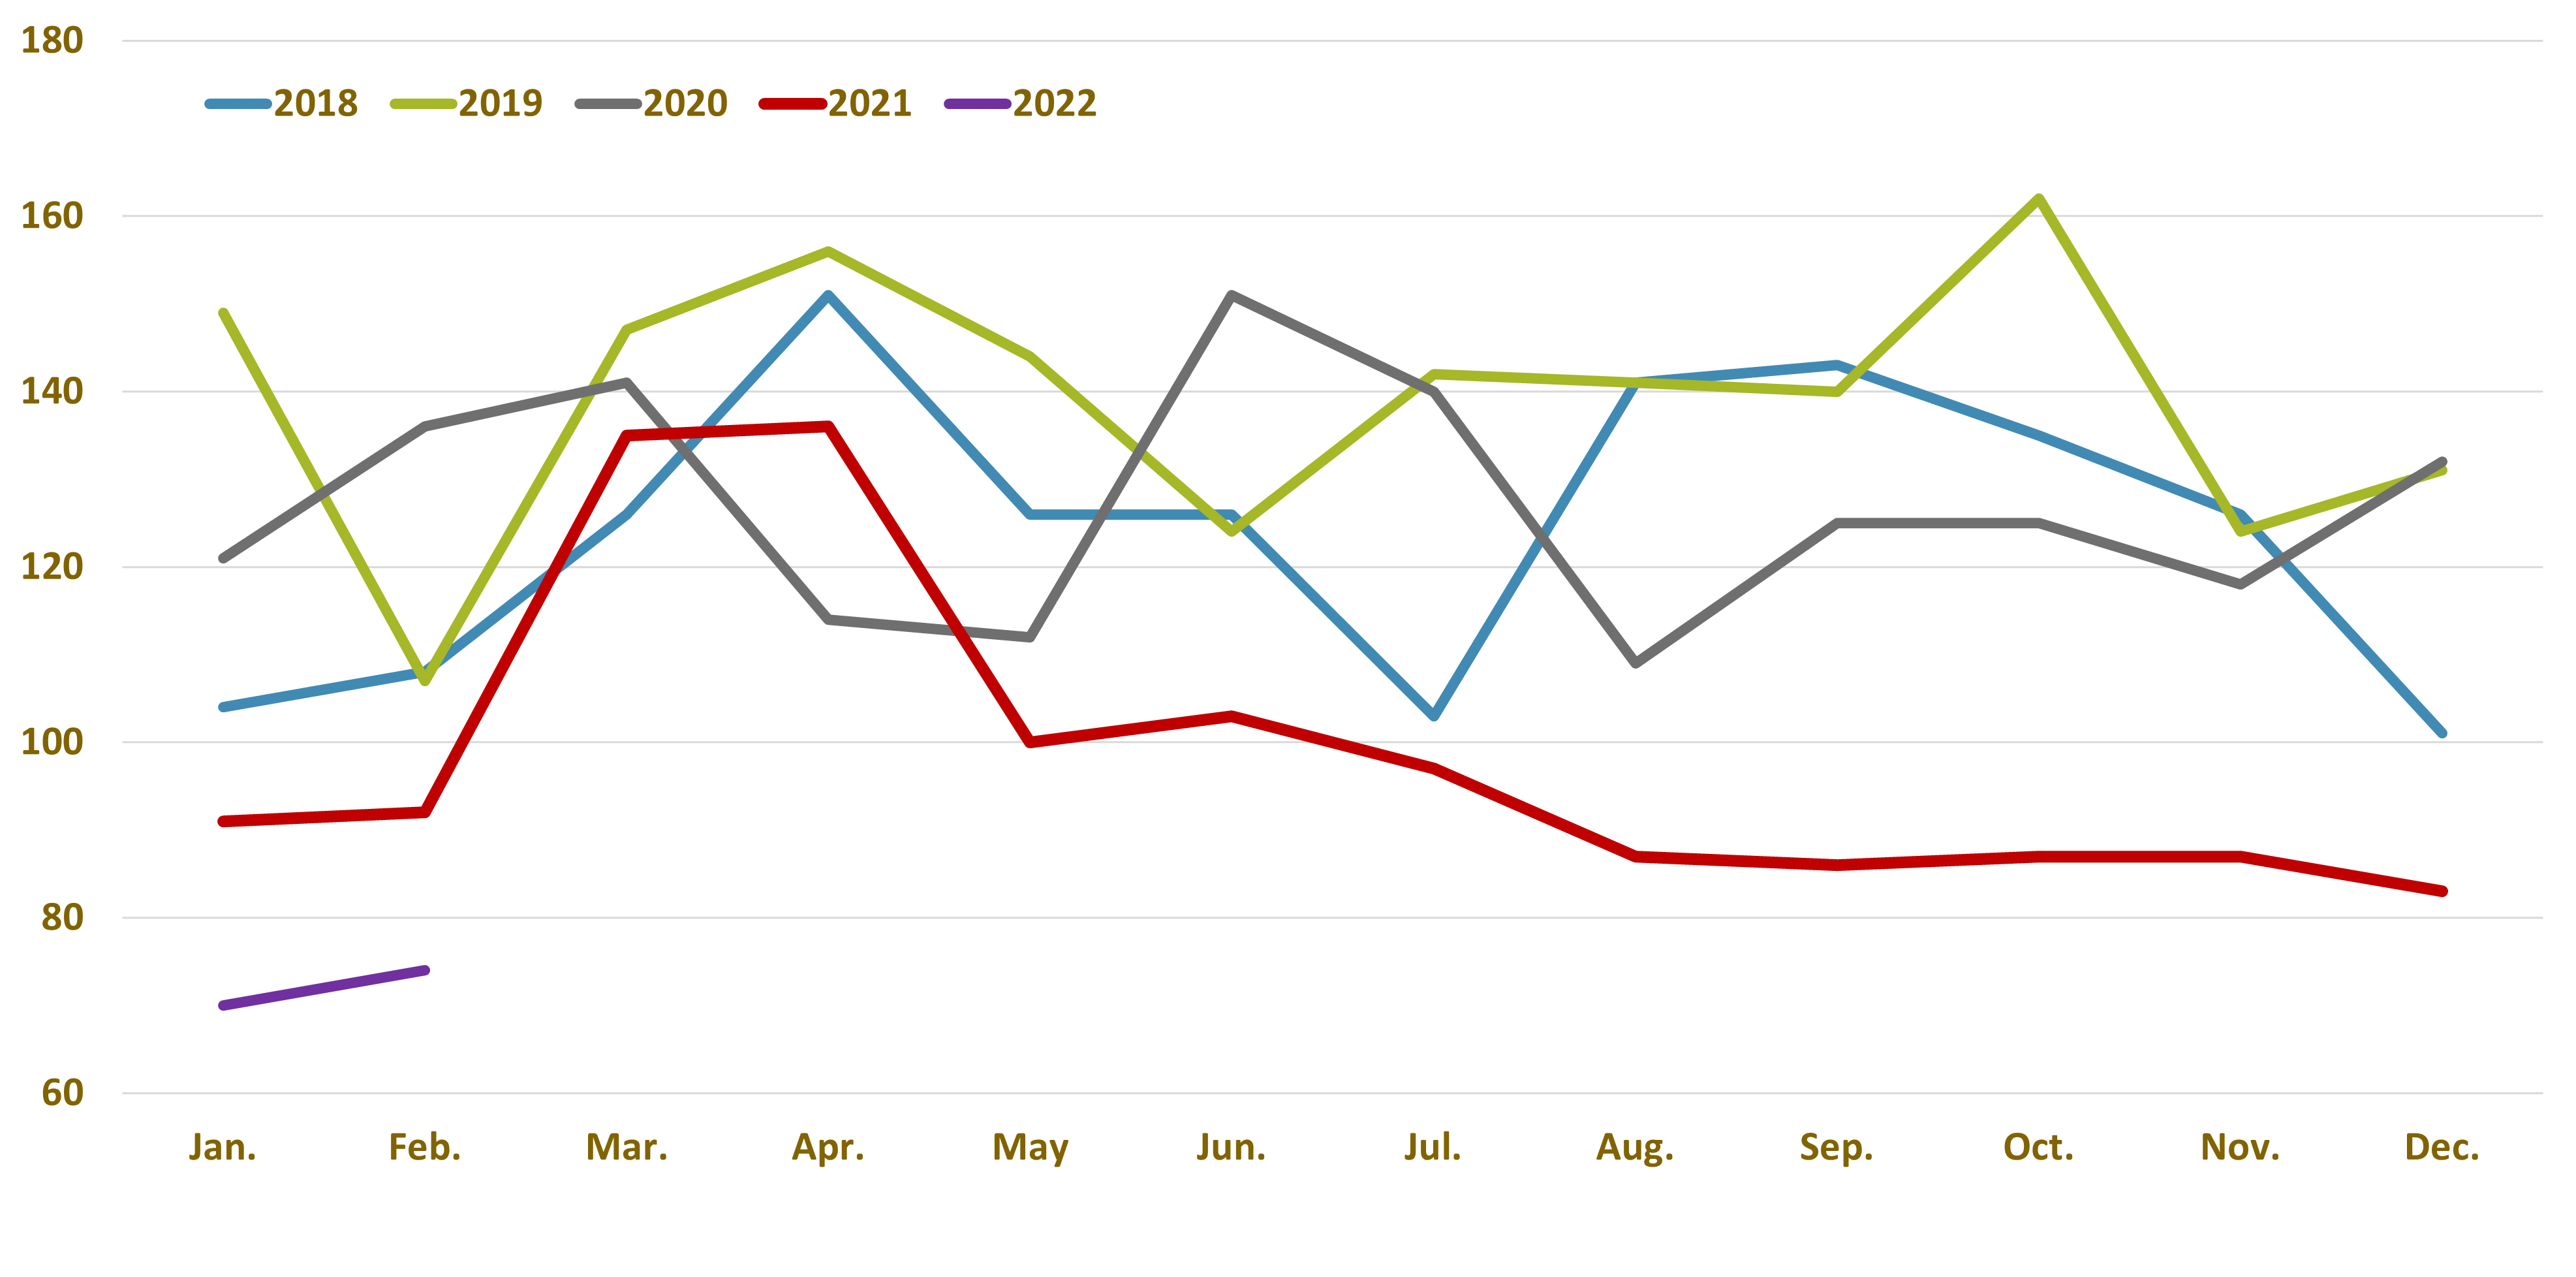
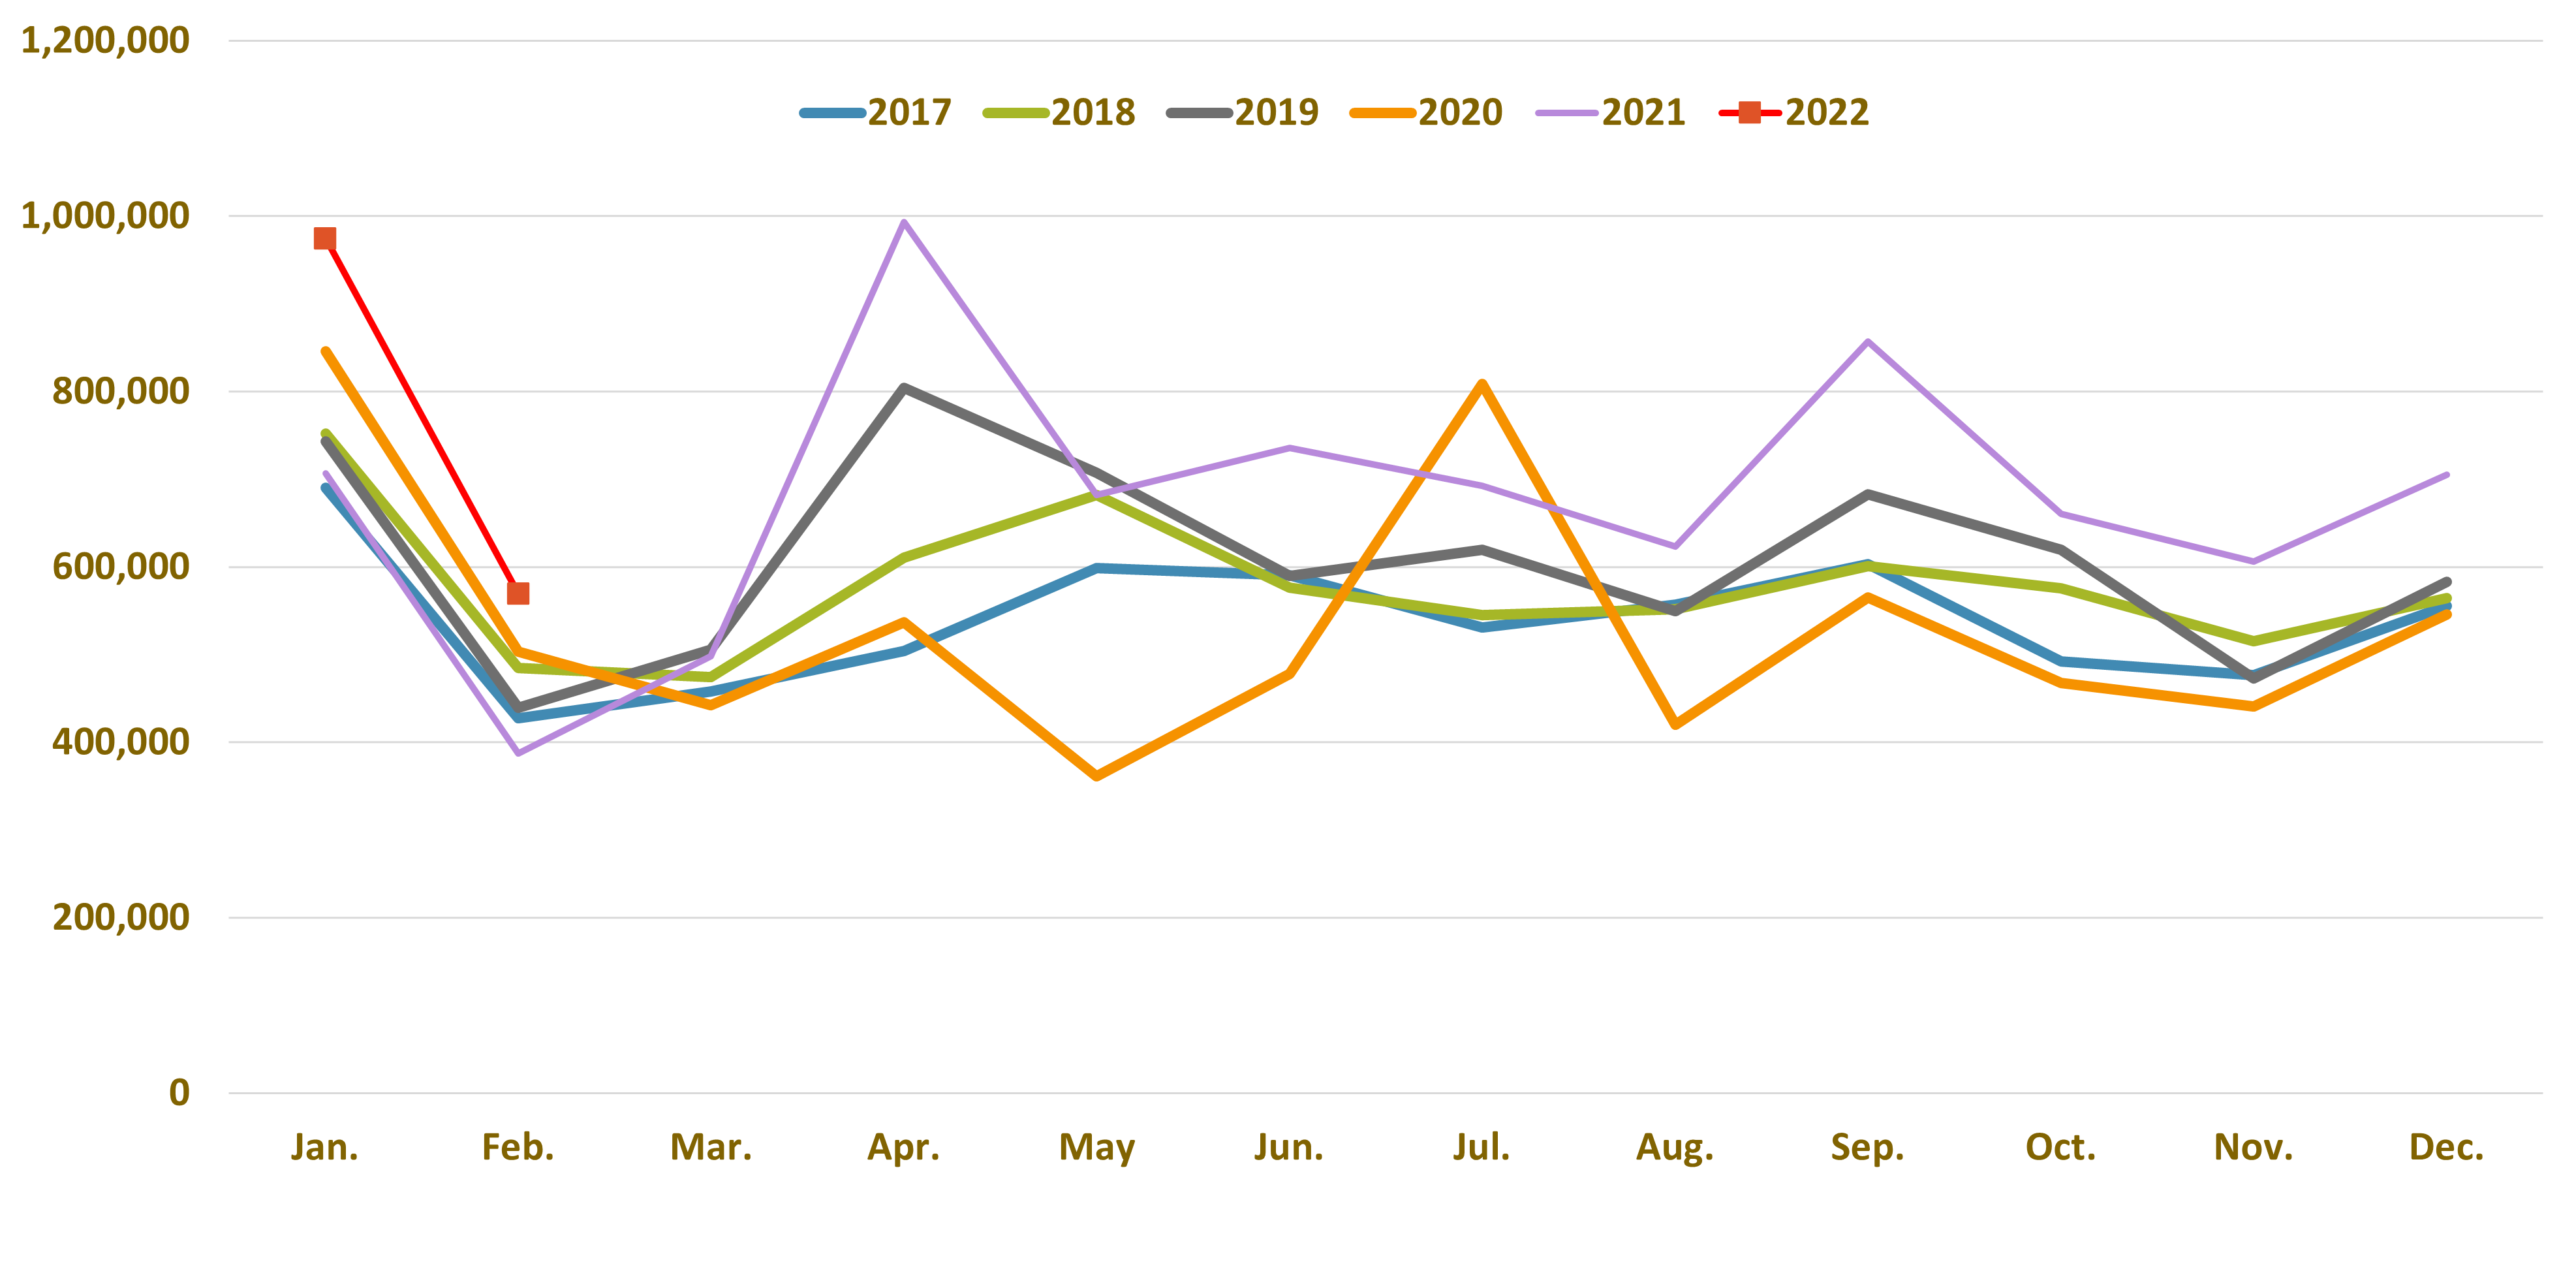
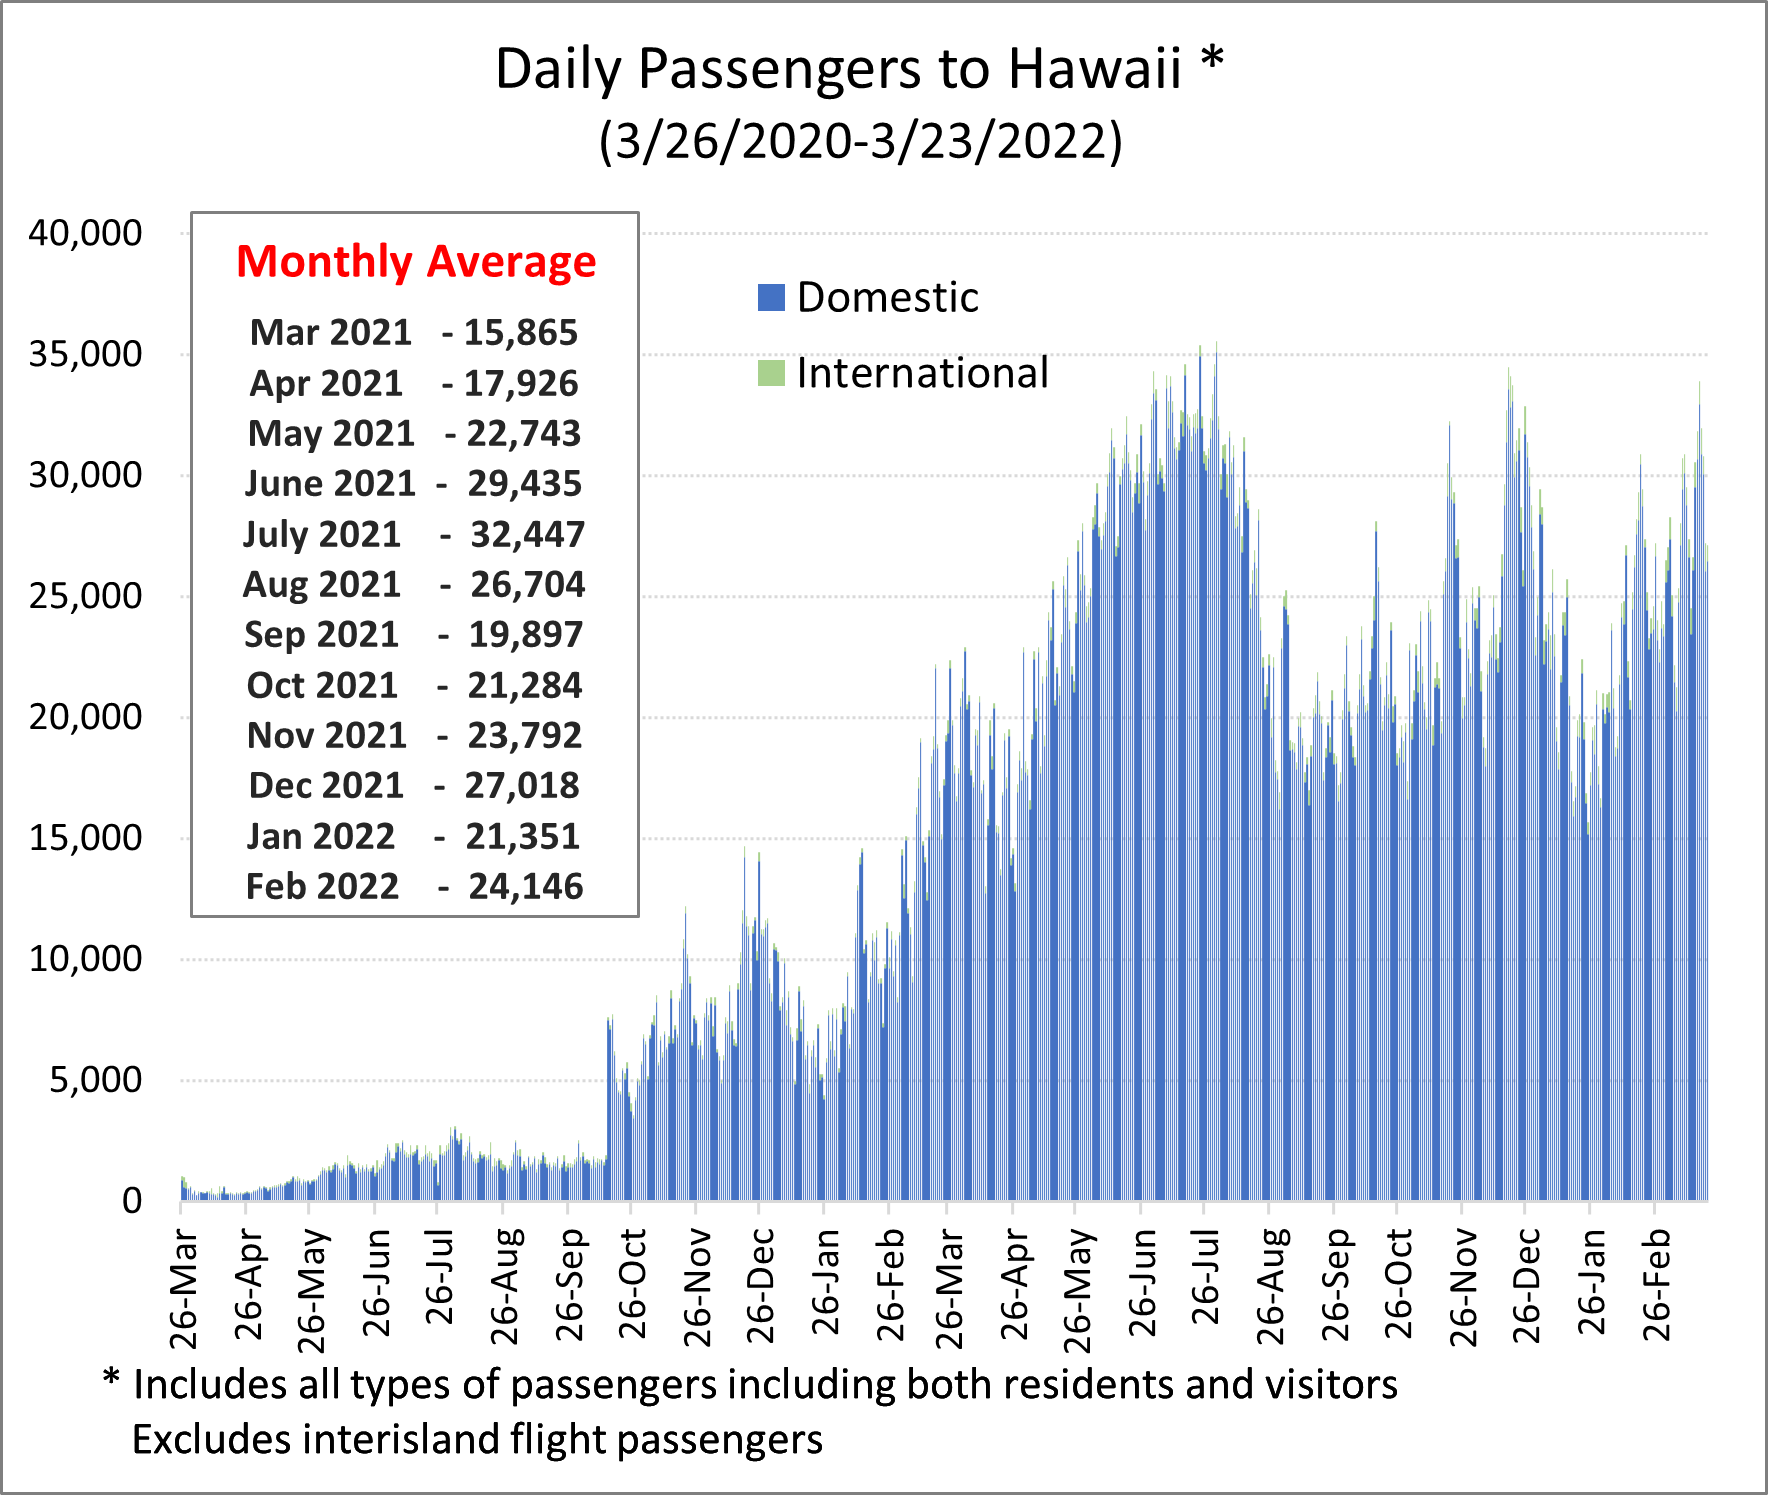
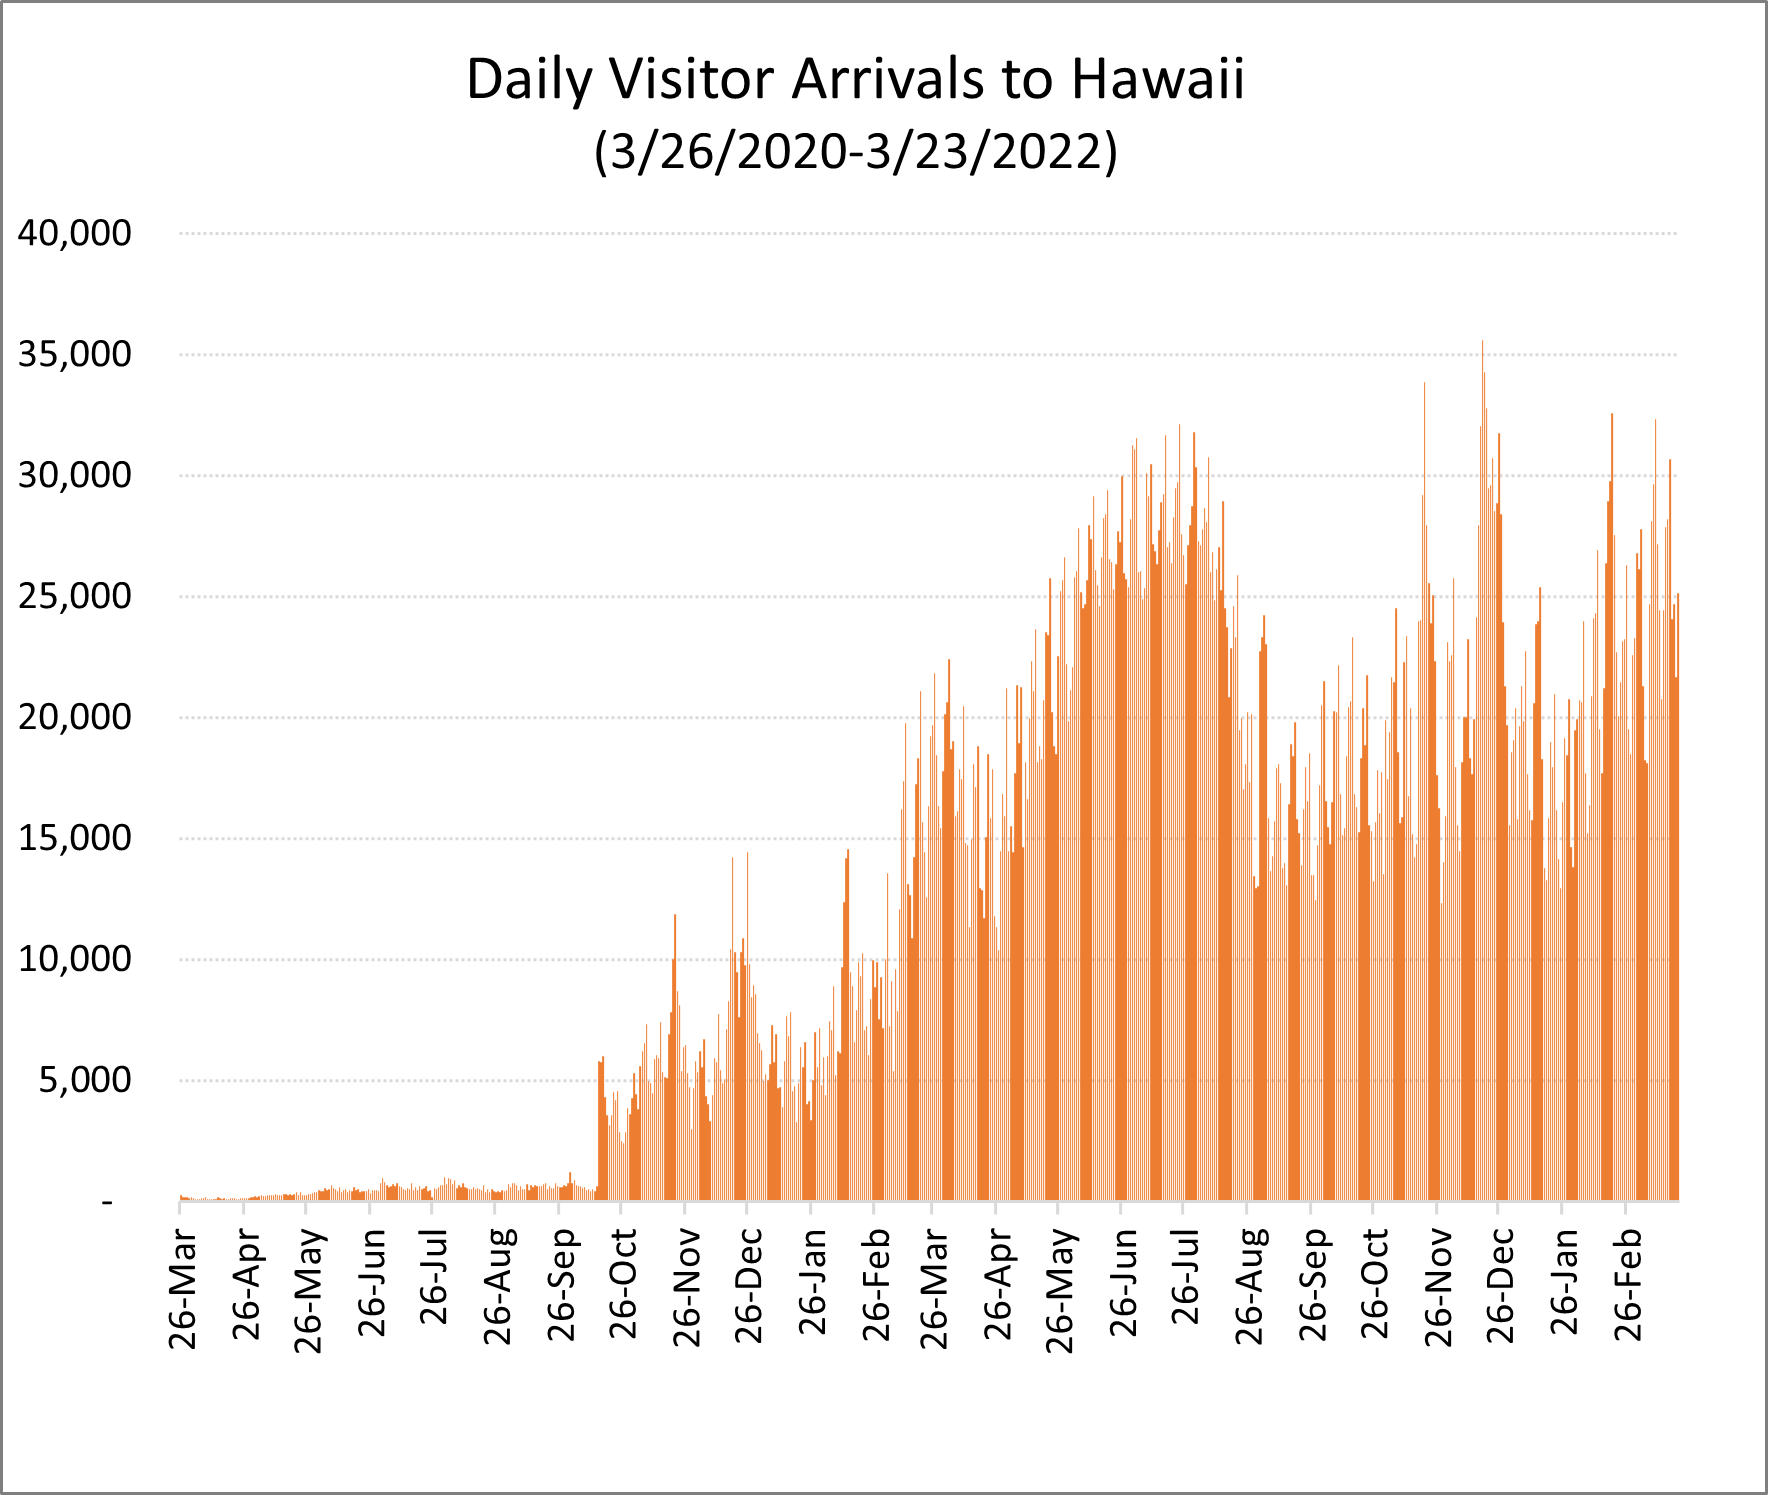
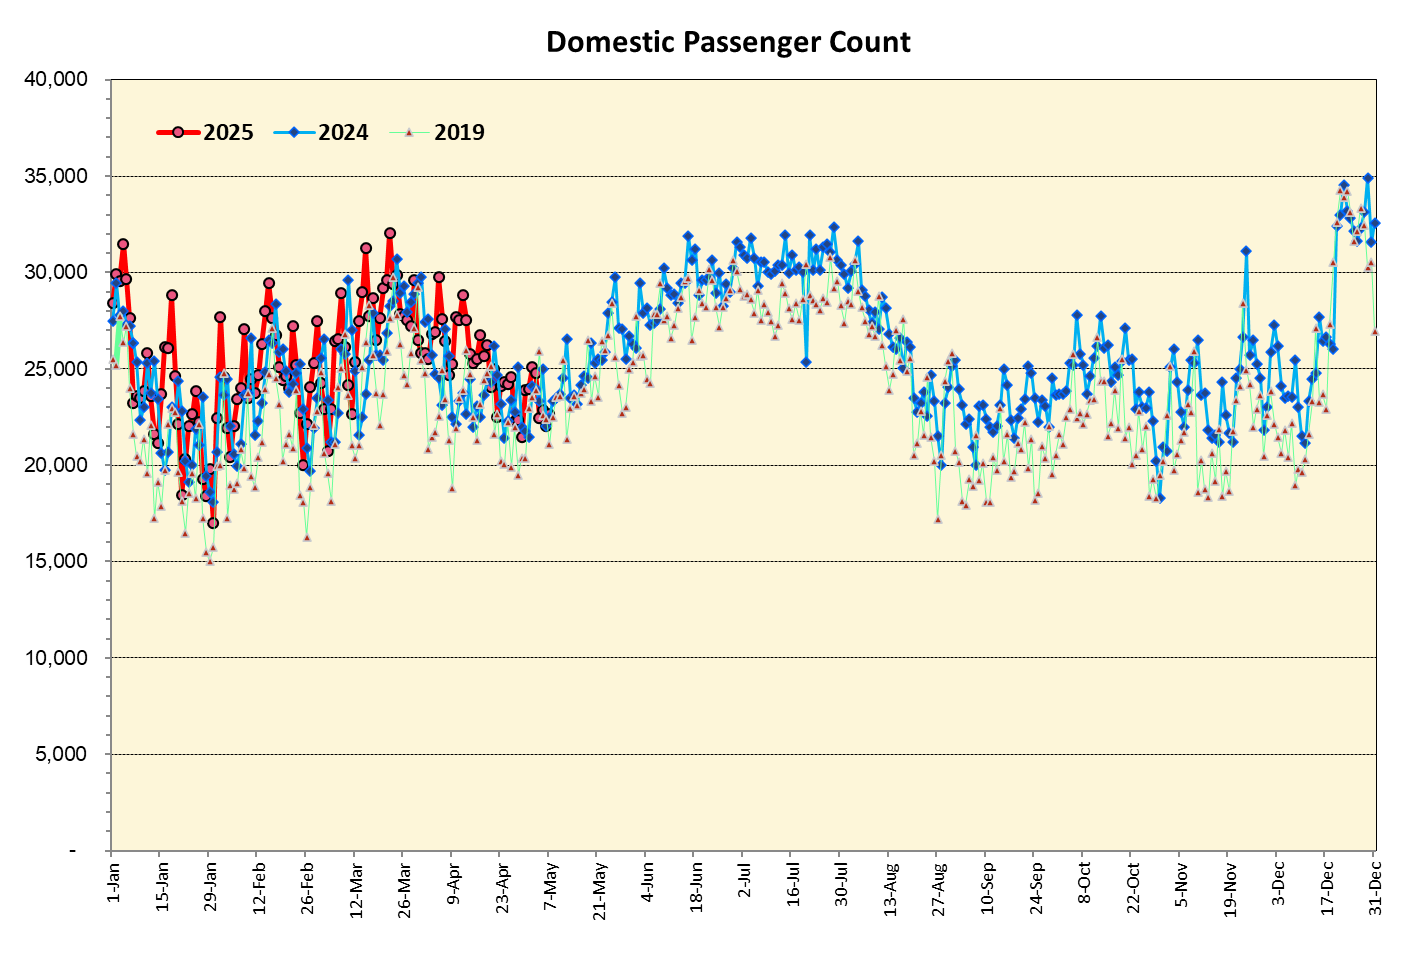
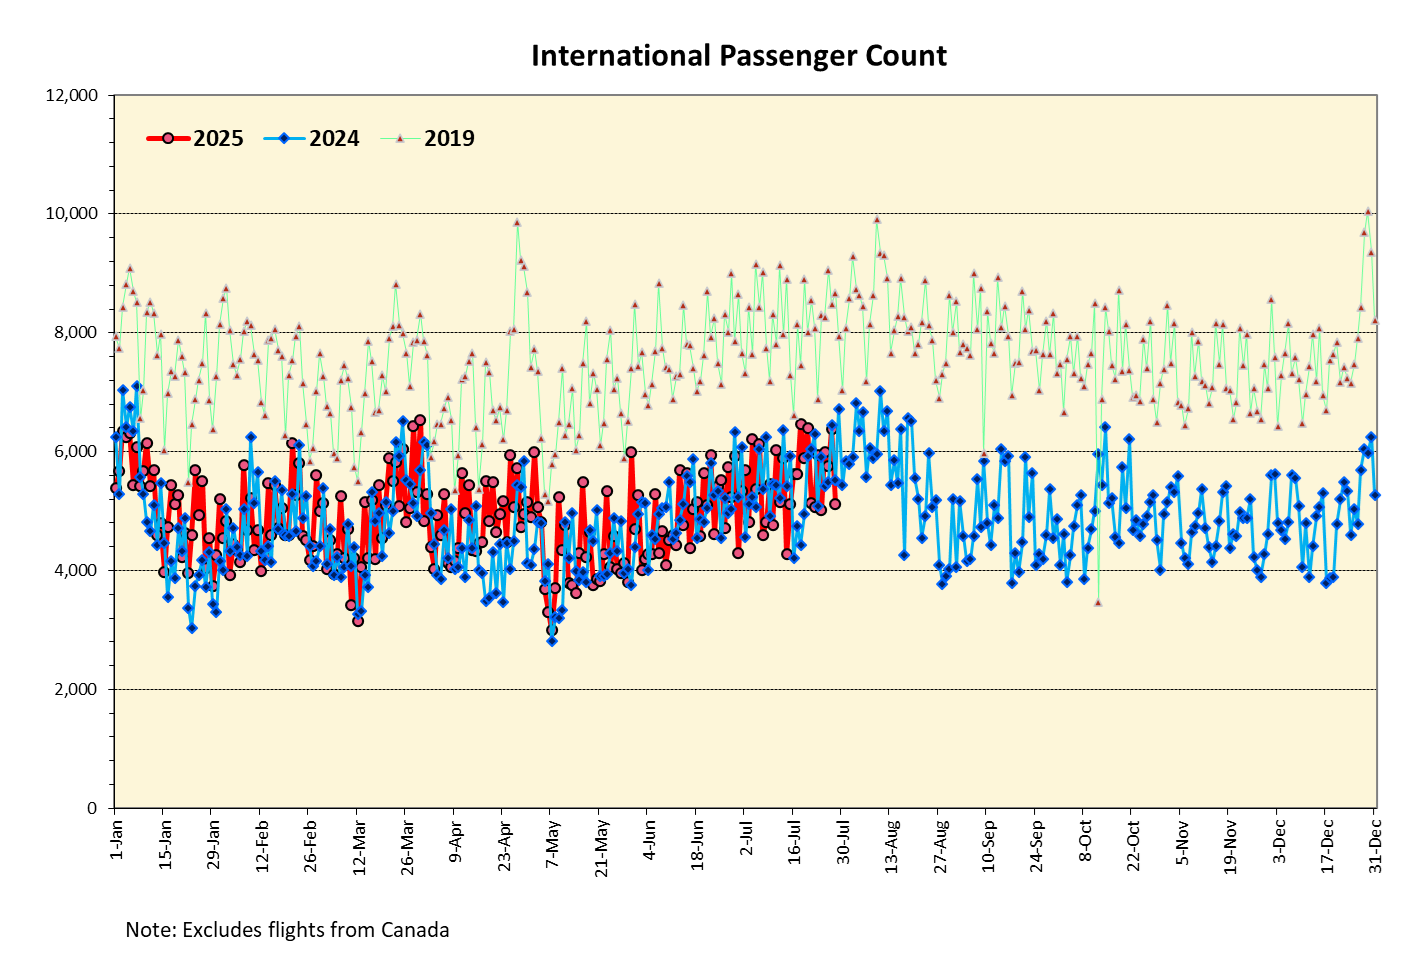
Daily Visitor Arrival Updates, Weekly Unemployment, and Monthly Job Changes, Bankruptcy Filings, and Tax Revenue
As of March 24
As of March 24
As of March 24
As of March 24
March – last updated March 24
| Total | Domestic | Int’l | Japan | Other int’l | |
| State | -12.5% | 9.4% | -87.6% | -96.7% | -65.2% |
| Oahu | 14.0% | ||||
| Hawaii | 5.2% | ||||
| Maui | 2.3% | ||||
| Kauai | 7.8% |
*By March 26, 2020, total arrivals had fallen to below 1,000 per day; the number of arrivals on April 1, 2021 exceeded the total number of arrivals in all of April 2020. Accordingly, 2020 comparisons hold little value, and 2022 arrivals are compared with 2019 arrivals.
Int’l = international
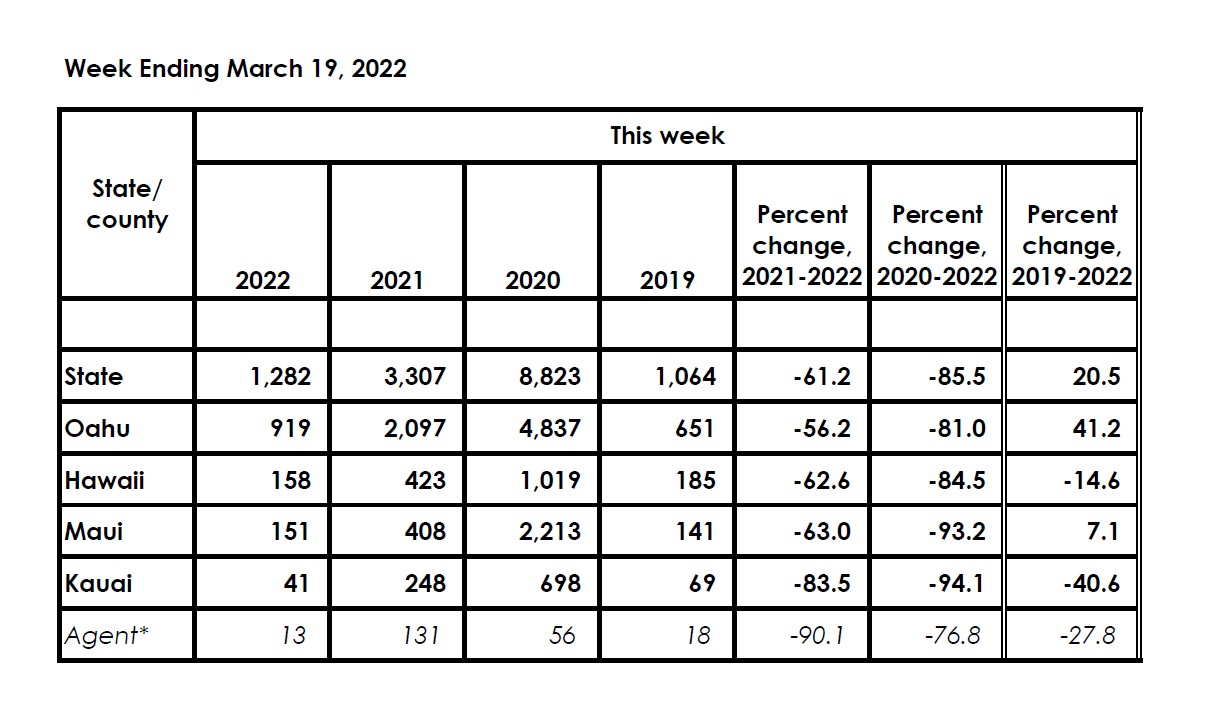
* Agent claims are filed in Hawaii against another state.
Week Ending 3/19/2022