New Forecast Continues to Show Lower Economic Growth in Hawaii in 2024
Posted on Mar 6, 2024 in NewsFor Immediate Release: March 6, 2024
HONOLULU—The Department of Business, Economic Development and Tourism (DBEDT) released its first quarter 2024 Statistical and Economic Report today. In the report, DBEDT revised its economic growth projections for 2024, as measured by the growth of real gross domestic product (GDP), slightly upward from 1.3 percent projected in the previous quarter, to 1.5 percent. Projections for 2025-2027 remain at about 2.0 percent economic growth.
The increase in economic growth is mainly caused by continued growth in household spending. Though visitor spending decreased by 4.5 percent in January 2024, state general excise tax (GET) collections were up by 2.4 percent during the same month, an increase which can be attributed to household spending. The primary driver of household spending was a 6.0 percent increase in personal income during the first three quarters of 2023 (latest data available). Wages and salaries, the largest component of personal income, increased by 7.4 percent during the period, double the average growth rate of the past 20 years (2002-2022).
Where Are We in Economic Recovery?
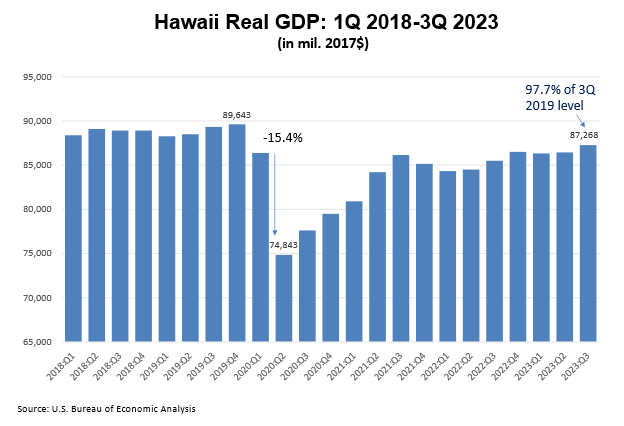
According to data from the U.S. Bureau of Economic Analysis, Hawaii’s real gross domestic product (GDP) in the third quarter of 2023 (latest estimate available) recovered to 97.7 percent of the same period in 2019. Hawaii’s non-tourism sectors were fully recovered in 2023 but the tourism sector, including transportation, retail trade, entertainment and recreation, accommodation, and food services industries, recovered only to about 90 percent of the 2019 level in the third quarter of 2023. Hawaii is one of three states in the nation that have not fully recovered from the 2020 recession caused by the COVID-19 pandemic. The other two states are North Dakota and Louisiana.
As of December 2023, Hawaii’s civilian labor force had recovered to 97.6 percent, the number of civilian people employed to 96.7 percent, and the non-agriculture payroll jobs to 96.0 percent of the same month 2019 levels.
Retail trade and financial activities (including real estate) are the two industry sectors with the lowest recovery rates, at 91.3 percent and 88.4 percent, respectively.
The Impact of the Maui Wildfires
The Maui wildfires in August 2023 slowed Hawaii’s economic recovery. The impact will last for a few years. The economic recovery seen in the first seven months of 2023 was dealt a significant blow by the Maui wildfires.
All four counties experienced slowdowns in economic activity with Maui experiencing the greatest reductions, especially in tourism. Visitor arrivals to Maui County declined by 41.4 percent and visitor expenditures by 31.1 percent during the last five months of 2023, from the same period in 2022. The decrease in visitor arrivals to Maui County impacted other islands, because over 30 percent of the visitors to Maui also visit other islands in the state.
Visitor arrivals to other counties continued to increase, but at a diminished rate during the last five months of 2023. Visitor spending in Hawaii County and Kauai County increased in the last five months, while visitor spending on Oahu decreased by 1.5 percent.
| Indicator | First 7 months | Last 5 months | Annual growth |
|---|---|---|---|
| Labor force | 0.5 | -0.8 | -0.1 |
| Number of people employed | 0.9 | -0.2 | 0.5 |
| Non-agriculture payroll jobs | 3.2 | 1 | 2.3 |
| General excise tax collections | 8 | 0.6 | 4.9 |
| State TAT collections | 6.4 | -4.5 | 2 |
| Value of private building permits | 19.8 | -14.5 | 2.5 |
| Total visitor arrivals | 10.4 | -3.7 | 4.4 |
| Total visitor expenditures | 13 | -4.8 | 5.5 |
Source: DBEDT, DOTAX, U.S. Census Bureau, and County Building Departments.
| County | Civilian labor force |
Number of civilian people employed |
Total non-agriculture payroll jobs |
Value of private Building Permits |
Air visitor arrivals |
Air visitor expenditures |
|---|---|---|---|---|---|---|
| Honolulu County | ||||||
| First 7 months | 0.40% | 0.80% | 3.20% | 17.50% | 19.10% | 7.70% |
| Last 5 months | -1.20% | 0.00% | 1.40% | -28.10% | 11.00% | -1.50% |
| Annual growth | -0.30% | 0.50% | 2.40% | -8.00% | 15.60% | 3.70% |
| Hawaii County | ||||||
| First 7 months | 0.80% | 0.90% | 3.60% | 10.50% | 8.10% | 8.20% |
| Last 5 months | 0.30% | 1.60% | 2.90% | -6.40% | 2.90% | 14.30% |
| Annual growth | 0.60% | 1.20% | 3.30% | 3.30% | 5.90% | 10.80% |
| Maui County | ||||||
| First 7 months | 0.50% | 1.00% | 2.90% | 39.00% | 3.80% | 19.00% |
| Last 5 months | -0.20% | -3.10% | -2.70% | 30.90% | -41.40% | -31.10% |
| Annual growth | 0.20% | -0.70% | 0.50% | 35.40% | -14.90% | -1.50% |
| Kauai County | ||||||
| First 7 months | 0.60% | 1.40% | 3.90% | 26.30% | 5.90% | 20.90% |
| Last 5 months | -0.90% | 0.30% | 1.30% | -1.40% | 4.50% | 28.70% |
| Annual growth | 0.00% | 0.90% | 2.80% | 13.00% | 5.30% | 24.10% |
State general excise tax revenue, which is a comprehensive measure of economic activity, increased by 0.6 percent during the last five months of 2023. This increase was mainly due to inflation during this period. The Honolulu Consumer Price Index, a measure of consumer inflation for Oahu, increased 2.9 percent during the second half of 2023.
During the first seven months of 2023, weekly initial unemployment claims were all below the 2019 levels of the comparative period. During the last five months of 2023, the other counties remained at low weekly initial unemployment claims, but Maui’s weekly unemployment claims jumped by 556.2 percent from 146 cases per week to an average of 961 cases per week.
National Economic Conditions
Data released by the U.S. Bureau of Economic Analysis on February 28, 2024, indicated that the U.S. economy had grown by 2.5 percent in 2023, far higher than the 0.5 percent rate it had initially forecast.
According to the most recent (February 2024) economic projections by the top 50 economic forecasting organizations published in Blue Chip Economic Indicators, U.S. economic growth is expected to be 2.1 percent in 2024 and 1.7 percent in 2025. The 2024 U.S. economic growth projection was an improvement from the 1.6 percent projected at the beginning of the year.
These growth rates exceeded prior expectations as consumer spending, private investment, and government spending were stronger than expected.
Following seven interest rate hikes in 2022 and four interest rates hikes in 2023, the last increase in July, the Federal Reserve has left interest rates unchanged at its last three meetings. Most economists believe that there might be interest rate cuts during the first half of 2024.
Forecasting Results
In the current report, DBEDT predicts that the economic growth rate for Hawaii, as measured by the percentage change in real GDP, will increase by 1.5 percent in 2024 from 2023. In 2025, economic growth is expected to reach 1.9 for the state. In 2026 and 2027, economic growth for Hawaii is expected to be 2.1 percent and 2.2 percent respectively, as reconstruction activities on Maui progress.
Visitor arrivals are projected to reach 9.8 million in 2024, about the same as previously projected. The current forecast expects full visitor arrival recovery in 2027, when 10.4 million visitors will come to the state. The last peak in visitor arrivals in Hawaii was in 2019 when 10.3 million trips were made by out-of-state visitors. Visitor spending is projected to be $21.4 billion in 2024 and is expected to increase to $23.7 billion by 2027.
As currently scheduled, total air seats are expected to increase by 1.5 percent in 2024. The increase in air seats will be mainly coming from Japan, where capacity is forecast to increase by 39 percent from 2023 levels. Hawaii will benefit from growth in seats from other international markets including the Philippines and other Pacific-island nations at a 19.9 percent increase, and Korea at a 3 percent increase. Air services from other markets will experience decreases in 2024, with air seats from the U.S. expected to decrease by 2.2 percent in 2024 as compared with 2023.
Non-agriculture payroll jobs growth for 2024 is expected to slow to 1.4 percent and will increase to 1.6 percent for both 2025 and 2026. The full recovery of non-agriculture payroll jobs is expected to be in 2026, when total will reach 661,900 jobs, surpassing the 2019 total of 659,000.
The state unemployment rate is expected to be at 2.8 percent in 2024, and will improve to 2.6 percent in 2025, 2.4 percent in 2026, and 2.3 percent in 2027.
Personal income is expected to grow at rates around 4 percent in the next few years, about the same as projected in the previous quarter.
As measured by the Honolulu Consumer Price Index for Urban Consumers, inflation is expected to be 2.8 percent in 2024, which is higher than the projected U.S. consumer inflation rate of 2.6 percent for the same year. Hawaii consumer inflation is expected to decrease to 2.2 percent by 2027.
Hawaii’s population is expected to be flat for 2024 and will increase at 0.1 percent in 2025 and 0.2 percent for both 2026 and 2027.
Statement of DBEDT Director James Kunane Tokioka
Our new forecast has three implications: (1) our economy is going to grow slowly in 2024, and while it is not a recession, it will be slower than our growth last year and slower than the nation’s economic growth; (2) it will take longer than expected for our economy to recover to the pre-pandemic level, about seven years for tourism and job recovery; and (3) the impacts of the Maui wildfires may last a few years and the impacts will continue to affect the other counties.
During this recovery period, governments play an important role in the economy. The level of government contracts awarded in 2023 reached an all-time high of $5 billion, including contracts awarded by all three levels of government. These government contracts will help our construction industry in 2024 and in future years. The state government has been spending an average of $1.4 billion a year on capital improvement projects during the past 10 years and the construction industry is believed to be further boosted by the Governor’s affordable housing initiatives.
Though it will take time for our economy to recover and grow, we see signs of improvement. The recovery of airlift from Japan and other international destinations is promising, and we saw the passenger count from Japan increase by 84 percent during the first two months of 2024 compared to the same period a year ago. As we expected, the passenger count from Japan in the first two months of 2024 reached more than 60 percent of the level from same period in 2019. We are hopeful that this trend will continue for the rest of the year.
The full report is available at: dbedt.hawaii.gov/economic/qser.
# # #
MEDIA CONTACTS:
Dr. Eugene Tian
Research and Economic Analysis Division
Department of Business, Economic Development & Tourism
(808) 586-2470
dbedt.hawaii.gov/economic
Laci Goshi
Department of Business, Economic Development & Tourism
(808) 587-9006
dbedt.hawaii.gov
| Economic Indicators | 2022 | 2023 ¹ | 2024 | 2025 | 2026 | 2027 |
|---|---|---|---|---|---|---|
| Actual | Forecast | |||||
| Total population (thousands) ² | 1,439 | 1,435 | 1,435 | 1,436 | 1,439 | 1,442 |
| Visitor arrivals (thousands) ³ | 9,234 | 9,645 | 9,782 | 10,010 | 10,238 | 10,444 |
| Visitor days (thousands) ³ | 85,240 | 86,340 | 86,596 | 88,439 | 89,971 | 91,296 |
| Visitor expenditures (million dollars) ³ | 19,800 | 20,918 | 21,385 | 22,210 | 22,967 | 23,697 |
| Honolulu CPI-U (1982-84=100) | 316.1 | 326.0 | 335.2 | 343.7 | 351.8 | 359.5 |
| Personal income (million dollars) | 88,973 | 93,219 | 96,762 | 100,535 | 104,557 | 108,844 |
| Real personal income (millions of 2017$) | 69,266 | 70,887 | 71,716 | 72,624 | 73,615 | 74,911 |
| Personal income deflator | 128.5 | 131.5 | 134.9 | 138.4 | 142.0 | 145.3 |
| Non-agricultural wage & salary jobs (thousands) | 618.1 | 632.2 | 641.2 | 651.5 | 661.9 | 671.1 |
| Civilian unemployment rate | 3.5 | 3.0 | 2.8 | 2.6 | 2.4 | 2.3 |
| Gross domestic product (million dollars) | 101,083 | 107,107 | 111,431 | 115,819 | 120,380 | 124,997 |
| Real gross domestic product (millions of 2017$) | 85,211 | 87,082 | 88,388 | 90,068 | 91,959 | 93,982 |
| Gross domestic product deflator | 118.6 | 123.0 | 126.1 | 128.6 | 130.9 | 133.0 |
| Annual Percentage Change | ||||||
| Total population | -0.5 | -0.3 | 0.0 | 0.1 | 0.2 | 0.2 |
| Visitor arrivals | 36.2 | 4.4 | 1.4 | 2.3 | 2.3 | 2.0 |
| Visitor days | 30.5 | 1.3 | 0.3 | 2.1 | 1.7 | 1.5 |
| Visitor expenditures | 50.5 | 5.6 | 2.2 | 3.9 | 3.4 | 3.2 |
| Honolulu CPI-U | 6.5 | 3.1 | 2.8 | 2.5 | 2.4 | 2.2 |
| Personal income | 0.0 | 4.8 | 3.8 | 3.9 | 4.0 | 4.1 |
| Real personal income | -4.7 | 2.3 | 1.2 | 1.3 | 1.4 | 1.8 |
| Personal income deflator (2017=100) | 5.0 | 2.4 | 2.6 | 2.6 | 2.6 | 2.3 |
| Non-agricultural wage & salary jobs | 5.3 | 2.3 | 1.4 | 1.6 | 1.6 | 1.4 |
| Civilian unemployment rate 4 | -2.5 | -0.5 | -0.2 | -0.2 | -0.2 | -0.1 |
| Gross domestic product | 8.6 | 6.0 | 4.0 | 3.9 | 3.9 | 3.8 |
| Real gross domestic product | 1.3 | 2.2 | 1.5 | 1.9 | 2.1 | 2.2 |
| Gross domestic product deflator (2017=100) | 7.2 | 3.7 | 2.5 | 2.0 | 1.8 | 1.6 |
2/ July 1 count.
3/ Visitors who came to Hawaii by air and by cruise ship. Expenditures includes supplementary business expenditures.
4/ Absolute change from previous year.
Source: Hawaii State Department of Business, Economic Development & Tourism, March 6, 2024.