State Continues to Forecast a Better Hawaii Economy than the Nation in 2023
Posted on Mar 2, 2023 in NewsFor Immediate Release: March 2, 2023
HONOLULU—The Department of Business, Economic Development and Tourism (DBEDT) released its first quarter 2023 Statistical and Economic Report today. DBEDT kept its economic growth projections for 2023 and 2024 at 1.7 percent and 2.1 percent, respectively, unchanged from the projections made in the previous quarter. According to the most recent (February 2023) economic projections by the top 50 economic forecasting organizations published in Blue Chip Economic Indicators, U.S. economic growth in 2023 is expected to be at 0.7 percent and 1.2 percent for 2024.
The U.S. economy recovered in 2021 in terms of the value of total real gross domestic product (GDP) and recovered in 2022 in terms of total job count and unemployment rate. The Hawaii economy is still recovering from the recession caused by the COVID-19 pandemic. As of the third quarter of 2022, the latest GDP data available at the state level, total real GDP recovered by 95.2 percent as compared with 2019. Real GDP in tourism related sectors (transportation, retail, accommodation, and food services) recovered at 83.5 percent while non-tourism sectors recovered at 98.7 percent. The total non-agriculture payroll job count recovered 92.6 percent in 2022 and the unemployment rate in 2022 (3.5% not seasonally adjusted) was one percentage point higher than the level in 2019 (2.5%).
Areas showing improvements include the declining inflation rate, continued recovery in tourism, catching up of construction activities, and continued double-digit growth of tax revenue collections. Areas of concern include the declining U.S. and world projections of economic growth in the next few years, continuation of the Ukraine War, high interest rates, labor shortage accompanied with higher unemployment, declining resident population, and uncertainty of the ending of the COVID-19 pandemic.
Inflation rates declining accompanied by higher interest rates. Starting in March 2021, the Hawaii inflation rate has been consistently below the U.S. inflation rate. The Hawaii inflation rate has been declining since May 2022 while the U.S. inflation rate started to decline in July 2022. As of January 2023, the Hawaii inflation rate was at 5.2 percent and the U.S. inflation rate was at 6.4 percent.
In fighting inflation, the Federal Reserve Bank (Fed) raised interest rates seven times in 2022 for a total 4.25 percent increase in the Federal fund rate. The Fed raised the interest rate again by 0.25 of one percentage point in February 2023 and it is expected that the Fed will increase the interest rate three more times in the rest of 2023.
| Period | Hawaii | U.S. |
|---|---|---|
| Jan. 2020 | 1.7 | 2.5 |
| Mar. 2020 | 1.8 | 1.5 |
| May 2020 | 1.3 | 0.1 |
| Jul. 2020 | 1.3 | 1 |
| Sep. 2020 | 1.9 | 1.4 |
| Nov. 2020 | 1.6 | 1.2 |
| Jan. 2021 | 1.4 | 1.4 |
| Mar. 2021 | 1.8 | 2.6 |
| May 2021 | 3.8 | 5 |
| Jul. 2021 | 4.6 | 5.4 |
| Sep. 2021 | 5 | 5.4 |
| Nov. 2021 | 5.4 | 6.8 |
| Jan. 2022 | 6 | 7.5 |
| Mar. 2022 | 7.5 | 8.5 |
| May 2022 | 7 | 8.6 |
| Jul. 2022 | 6.8 | 8.5 |
| Sep. 2022 | 6.6 | 8.2 |
| Nov. 2022 | 5.8 | 7.1 |
| Jan. 2023 | 5.2 | 6.4 |
Source: U.S. Bureau of Labor Statistics
Increasing the interest rate helped control the inflation rate, but at the same time, a higher interest rate limits people’s ability to purchase homes. In 2022, a total of 21,131 homes were sold which represented an 18.6 percent decrease from 2021. Of the homes sold in 2022, 75 percent were sold to Hawaii residents and 25 percent were purchased by out-of-state residents.
Tourism recovery continues. In 2022, visitor arrivals recovered 89 percent from the 2019 level of 10.4 million. Those visitors spent an estimated amount of $19.3 billion which was historically the highest in nominal dollars. The increase in visitor spending was mainly a result of inflation. In 2022, the number of visitors from other states in the U.S. was 12.9 percent higher than the 2019 level while visitors from international markets recovered 41.3 percent. Of the international visitors who came in 2022, Canadian visitors recovered by 74 percent and Japanese visitors recovered by 12.7 percent, while visitors from other international markets had a recovery rate of 63 percent. The number of visitors who came by cruise ships in 2022 was 33.5 percent lower than the count in 2019.
Monthly Visitor Arrivals
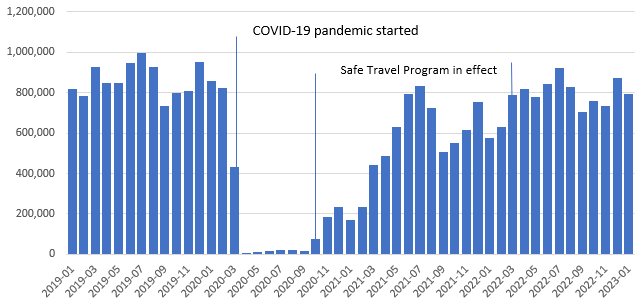
Source: Hawaii Tourism Authority and DBEDT
In January 2023, the total visitor count was 791,781, which represented a 96.8 percent recovery from the same month in 2019. The U.S. visitor count exceeded the January 2019 level by 18.6 percent. The Canadian visitor count was at 81.1 percent and the Japanese visitor count was at 26.8 percent of the respective January 2019 counts.
As currently scheduled, total air seats during the March to May 2023 period will increase by 4 percent compared to the same period in 2022. Seats from the U.S. mainland airports will decrease by 3.9 percent while seats from international airports will increase by 69 percent. Seats from Japan will increase by 318.3 percent during this period.
State GET collections continue to rise. After increasing by 18.3 percent in calendar year 2022 from calendar year 2021, state general excise tax (GET) revenue increased 12.3 percent in January 2023 from the same period a year ago. January 2023 marked the 22nd consecutive month that GET grew at double digits. GET is an indicator reflecting current business conditions in Hawaii. The increase in GET revenues was partially due to the higher inflation rate and economic growth. After adjusting for inflation using the Urban Hawaii consumer price index, real GET increased by 11.8 percent in calendar year 2022 from the previous calendar year. For January 2023, real GET growth was 6.7 percent over January 2022 collections.
Monthly General Excise Tax Collections
(In millions of 2022 dollars)
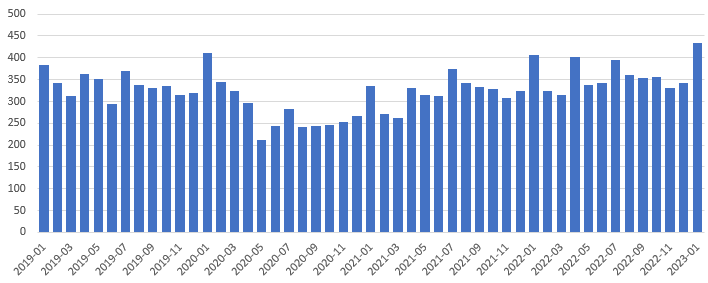
Source: Department of Taxation
Construction activity improving. The construction industry, as measured by the contracting tax base in current dollars increased by 5.6 percent during the first nine months of 2022.
Value of building permits issued (12 month moving average, in $mil.)
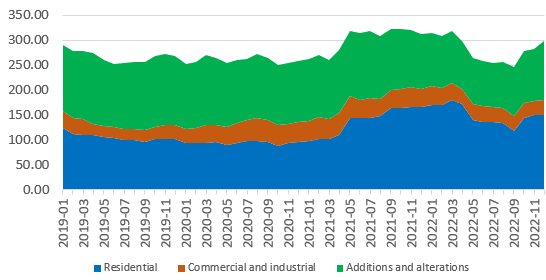
Source: County Building Departments
The value of private building permits declined during the first 9 months of 2022, compared to the first 9 months of 2021, but surged by 95.6% during the last quarter of 2022 relative to the fourth quarter of 2021, resulting an overall 4.5% decrease for the whole year of 2022. Most of the increase during the last quarter of 2022 was from the City and County of Honolulu where the value of building permits increased by 201.7 percent during the fourth quarter of 2022.
Government contracts awarded increased 15.9 percent in 2022 as compared with 2021. Construction activities in 2023 will be better than expected during the economic projections in 2022, though overall activities may still be slower due to the decrease in building permit issuance during the second and third quarters of 2022 and the inflation in the construction industry.
Labor market becoming stable though a labor shortage still exists. Labor statistics (labor force, employment, unemployment, and job count by industry) are being revised at this time by the U.S. Bureau of Labor Statistics and the revised data will be released on March 10, 2023. Based on the weekly initial unemployment claims data from the State Department of Labor and Industrial Relations, the average weekly initial unemployment claims were 1,218 in 2019 and the first three months of 2020. Since the beginning of 2022, the weekly average unemployment claims have stabilized at around 1,200, indicating that the labor market has been stable.
Weekly Initial Unemployment Claims
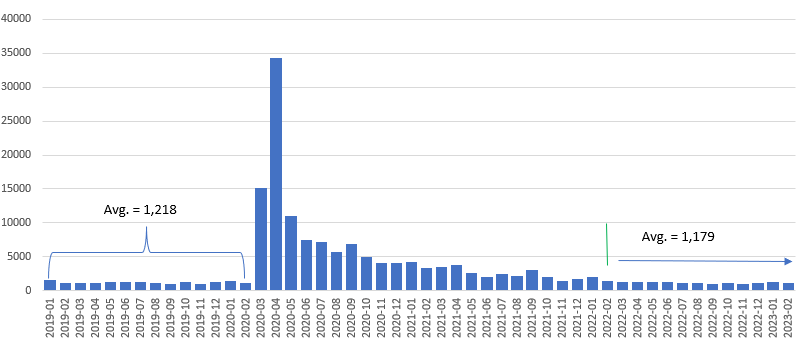
Source: Department of Labor and Industrial Relations
The labor shortage started in 2021 and improved by the end of 2022. In December 2021, Hawaii had 60,000 job openings statewide, and 25,000 of them were filled while 35,000 positions were left unfilled. By the end of 2022, there were 39,000 job openings and 19,000 of them were filled, with vacancies of 20,000. This represents an improvement from a year ago, but the level of vacancies is still very high. During 2019, the average monthly vacancies was 7,700.
Forecasting Results
In the current report, DBEDT predicts that the economic growth rate for Hawaii, as measured by the percentage change in real gross domestic product (GDP), will increase 1.7 percent in 2023 over the previous year. In 2024, economic growth is expected to accelerate to 2.1 for the state. These growth rates were the same as projected in the fourth quarter of 2022. In 2024 and 2025, economic growth for Hawaii is expected to return to normal growth levels at about 2 percent.
Visitor arrivals are projected to be 9.8 million in 2023, similar to the number projected in the previous quarter. Arrivals are projected to increase to over 10 million from 2024 and by 2025, visitor arrivals will be fully recovered to the pre-pandemic level of 10.3 million. Visitor spending is projected to be $20.8 billion in 2023 and is expected to increase to $23.4 billion in 2026.
Non-agriculture payroll jobs are forecasted to increase by 3.7 percent in 2023, higher than previously projected. Payroll job counts will increase by 2.1 percent in 2024, 1.9 percent in 2025, and 1.4 percent in 2026. For the current forecasting period (up to 2026), non-agriculture payroll jobs will recover to the pre-pandemic (2019) level by 2026.
In 2022, the Hawaii unemployment rate (not seasonally adjusted) was 3.5 percent, lower than the U.S. average of 3.6 percent. The state unemployment rate will continue to improve as economic recovery continues. The rate is projected to be 3.2 percent in 2023, 2.9 percent in 2024, 2.7 percent in 2025, and 2.6 percent in 2026.
During the pandemic, personal income surged due to government transfers related to unemployment insurance payments and other CARES Act funds. Due to a reduction in government support, personal income is estimated to decrease in 2022 by 0.7 percent and then grow around 3.0 percent for the following years.
As measured by the Honolulu Consumer Price Index for urban consumers, inflation is expected to be 3.1 percent in 2023, still lower than the projected U.S. consumer inflation rate of 3.6 percent for the same year. Hawaii consumer inflation is expected to decrease to 2.1 by 2026.
Statement by Director Chris J. Sadayasu
As our economy continues to improve, especially in tourism and construction, it is expected that the impact from the economic slowdown in the nation will be offset by the increase in international tourism. DBEDT is working closely with stakeholders across the state to diversify the economy and provide opportunities for the residents of Hawaii. DBEDT continues to foster planned community development, create affordable workforce housing units in high-quality living environments, and promote innovation sector job growth.
The full report is available at: dbedt.hawaii.gov/economic/qser.
# # #
MEDIA CONTACTS:
Dr. Eugene Tian
Research and Economic Analysis Division
Department of Business, Economic Development & Tourism
(808) 586-2470
dbedt.hawaii.gov/economic
Laci Goshi
Department of Business, Economic Development & Tourism
(808) 587-9006
dbedt.hawaii.gov
| Economic Indicators | 2021 | 2022 ¹ | 2023 | 2024 | 2025 | 2026 |
|---|---|---|---|---|---|---|
| Actual | Forecast | |||||
| Total population (thousands) ² | 1,447 | 1,440 | 1,440 | 1,441 | 1,443 | 1,445 |
| Visitor arrivals (thousands) ³ | 6,778 | 9,248 | 9,799 | 10,130 | 10,369 | 10,530 |
| Visitor days (thousands) ³ | 65,312 | 85,265 | 88,697 | 90,528 | 92,037 | 93,130 |
| Visitor expenditures (million dollars) ³ | 13,154 | 19,315 | 20,825 | 21,791 | 22,623 | 23,364 |
| Honolulu CPI-U (1982-84=100) | 296.8 | 316.1 | 326.0 | 333.7 | 341.0 | 348.1 |
| Personal income (million dollars) | 87,858 | 87,206 | 89,822 | 92,607 | 95,293 | 98,151 |
| Real personal income (millions of 2012$) | 67,312 | 64,272 | 64,917 | 65,768 | 66,457 | 67,290 |
| Personal income deflator (2012=100) | 130.5 | 135.7 | 138.4 | 140.8 | 143.4 | 145.9 |
| Non-agricultural wage & salary jobs (thousands) | 583.5 | 609.9 | 632.5 | 645.7 | 658.0 | 667.2 |
| Civilian unemployment rate | 6.0 | 3.5 | 3.2 | 2.9 | 2.7 | 2.6 |
| Gross domestic product (million dollars) | 91,096 | 97,745 | 102,060 | 106,269 | 110,203 | 114,107 |
| Real gross domestic product (millions of 2012$) | 74,547 | 75,846 | 77,135 | 78,755 | 80,251 | 81,696 |
| Gross domestic product deflator (2012=100) | 122.2 | 128.9 | 132.3 | 134.9 | 137.3 | 139.7 |
| Annual Percentage Change | ||||||
| Total population | -0.3 | -0.5 | 0.0 | 0.1 | 0.1 | 0.1 |
| Visitor arrivals | 150.3 | 36.4 | 6.0 | 3.4 | 2.4 | 1.6 |
| Visitor days | 127.9 | 30.6 | 4.0 | 2.1 | 1.7 | 1.2 |
| Visitor expenditures | 154.8 | 46.8 | 7.8 | 4.6 | 3.8 | 3.3 |
| Honolulu CPI-U | 3.8 | 6.5 | 3.1 | 2.4 | 2.2 | 2.1 |
| Personal income | 5.7 | -0.7 | 3.0 | 3.1 | 2.9 | 3.0 |
| Real personal income | 1.1 | -4.5 | 1.0 | 1.3 | 1.0 | 1.3 |
| Personal income deflator (2012=100) | 4.5 | 4.0 | 2.0 | 2.2 | 2.0 | 1.9 |
| Non-agricultural wage & salary jobs | 4.2 | 4.5 | 3.7 | 2.1 | 1.9 | 1.4 |
| Civilian unemployment rate 4 | -5.7 | -2.5 | -0.3 | -0.3 | -0.2 | -0.1 |
| Gross domestic product | 10.4 | 7.3 | 4.4 | 4.1 | 3.7 | 3.5 |
| Real gross domestic product | 6.3 | 1.7 | 1.7 | 2.1 | 1.9 | 1.8 |
| Gross domestic product deflator (2012=100) | 3.8 | 5.5 | 2.7 | 2.0 | 1.8 | 1.7 |
3/ Visitors who came to Hawaii by air and by cruise ship. Expenditures includes supplementary business expenditures.
4/ Absolute change from previous year.
Source: Hawaii State Department of Business, Economic Development & Tourism, March 2, 2023.