HI GPI – BUILT CAPITAL SERVICES
BUILT CAPITAL SERVICES (+KB)
GPI = U(PCE_ADJ + PP + KB + KS + KH – SC + KN – POL – DKN)
where PCE_ADJ = (PCE – DEFR – HI – CDE)*INQ
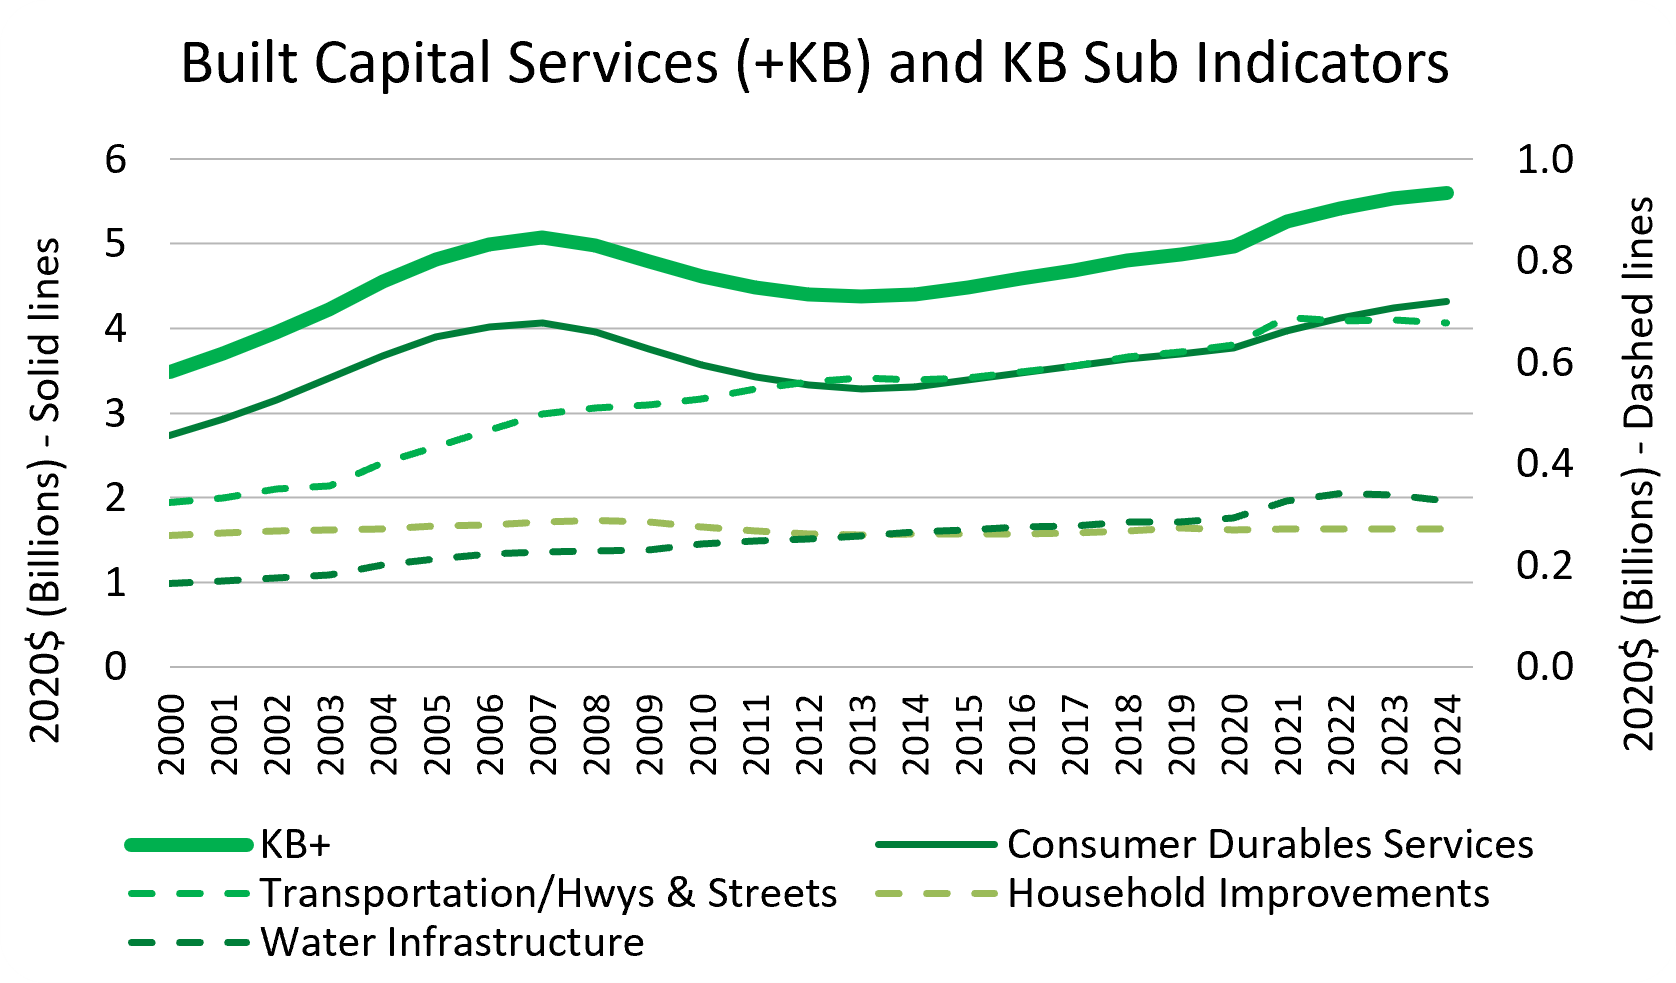
Built Capital Services (+KB)
While related additional non-consumption items are subtracted from PCE (e.g. -HI), the future services of these investments must then be accounted for here. Total services from Built Capital (+KB) include the value of transportation/highways & streets + water infrastructure + household improvements.
Built Capital Services (+KB) Sub Indicators:
Consumer Durables Services (CDS)
Consumer durables are goods that do not wear out quickly and therefore do not have to be purchased frequently. Examples of consumer durables include clothing, footwear, furnishings, household equipment, and vehicle purchases. Because Consumer Durables provide services beyond the initial year of purchase, consumer durable services are to be spread over an assumed eight years, and valued by multiplying the stock by a combination of a depreciation rate of 12.5% (assuming 100% depreciation divided by 8 years) and interest rate of 7.5% = 20%; uses BEA datasets for personal consumption expenditures on durable goods.
Transportation/Highways & Streets
Transportation stocks (streets and highways and transportation infrastructure for other types of transportation) provide ongoing services beyond the initial cost to construct them, thus transportation infrastructure provides long-term benefits to be spread over time; utilizes U.S. NIPA account data on current net of depreciation stock values; less 25% of highways/streets used for commuting to avoid double counting; current stocks then multiplied by factor of 10% (combining a depreciation rate of 2.5% plus an average interest rate of 7.5%).
Water Infrastructure
Water infrastructure provides long-term benefits to be spread over time; utilizes U.S. NIPA account data on current net of depreciation stock values and the corresponding per capita values for local jurisdiction. Annual estimate of services found by multiplying current stocks by 10% (combining a 2.5% depreciation rate + 7.5% average interest rate/time value of money).
Household Improvements
Accounting for the services of the household improvements that were deducted from the Household Investment indicator (-HI); stock year is calculated as the accumulation of the previous eight years of expenditures in the Household Investment indicator minus the standard 12.5% depreciation value. Expenditures in the current year are then added to the stock year calculation, and 20% of that final value is then added as value of annual services.