HI GPI – DEPLETION OF NATURAL CAPITAL
Depletion of Natural Capital (-DKN)
GPI = U(PCE_ADJ + PP + KB + KS + KH – SC + KN – POL – DKN)
where PCE_ADJ = (PCE – DEFR – HI – CDE)*INQ
Depletion of Natural Capital (-DKN)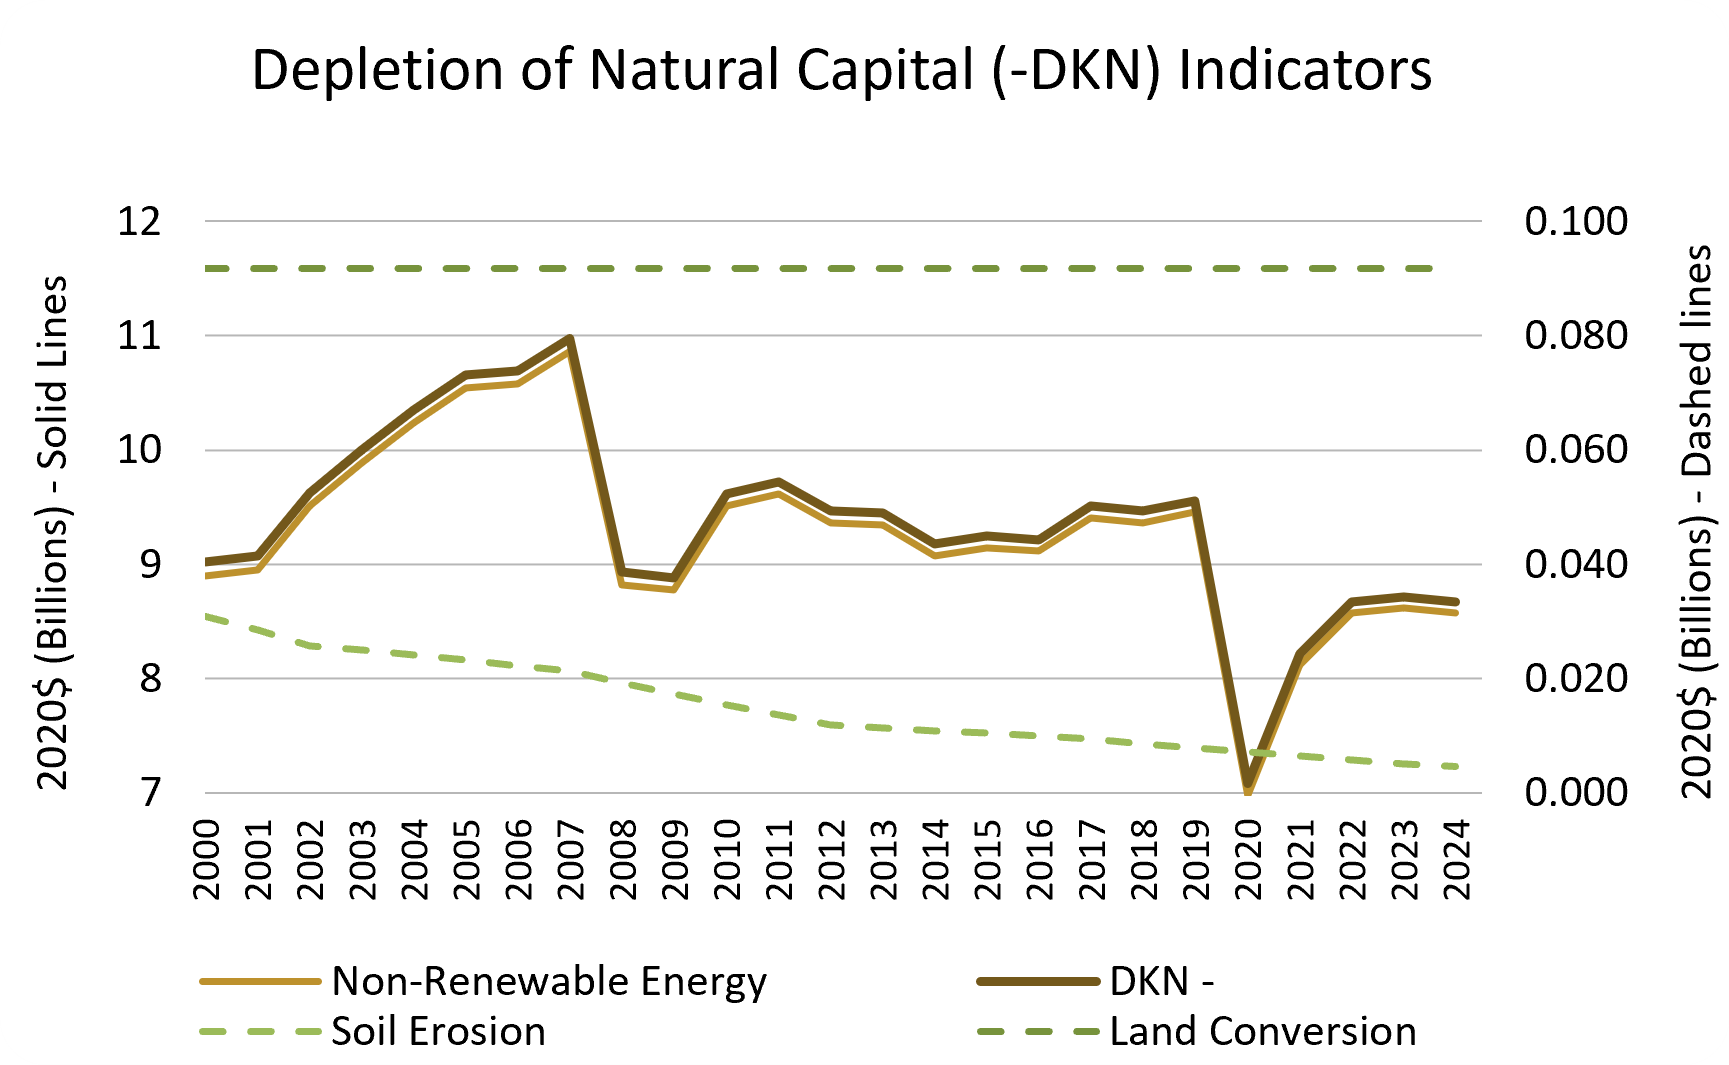
Justified as the decreased welfare generated by the depletion of different types of natural capital for those who are willing to pay to prevent their loss. Uses replacement costs using benefits transfer in the case of non-renewable energy, groundwater, and soil erosion; calculates net present value of changes from land conversion.
HI GPI – Depletion of Natural Capital (DKN) Indicators Excel Table
Non-Renewable Energy
Tracks depletion of non-renewable energy (NRE) resources and estimates the transition costs to replace NRE with renewable energy substitutes both inside and outside of the electric power sector; values replacement costs for transportation with biofuels, and electricity with solar and wind.
The decrease in Non-Renewable Energy costs in 2008 stems from changes in the consumption of natural gas and petroleum. The decrease in 2020 was the result of consumption changes during the COVID-19 pandemic.
Soil Erosion
Productivity losses can result due to soil erosion; accounted for as the replacement cost to restore soil lost due to soil erosion that typically results from economic activity and development.
Utilizes Natural Resource Conservation Service data on per acre erosion rates, USDA data on cultivated farmland, as well as urban land use erosion rates from EPA. Soil Erosion data released every five years. Last release was in year 2017, therefore years 2018 to 2023 were held constant from year 2017.
Land Conversion
Land conversions result from development and economic activity and impact ecosystems services provided by that land; valued as the marginal economic tradeoff of the land conversion activities. Calculates the NPV, over 50 years, at a 3% discount rate, using annual change in land cover and an ecosystem services value per unit of land cover type.