HI GPI – LOCAL POLLUTION COSTS
Local Pollution Costs (-POL)
GPI = U(PCE_ADJ + PP + KB + KS + KH – SC + KN – POL – DKN)
where PCE_ADJ = (PCE – DEFR – HI – CDE)*INQ
Local Pollution Costs (-POL)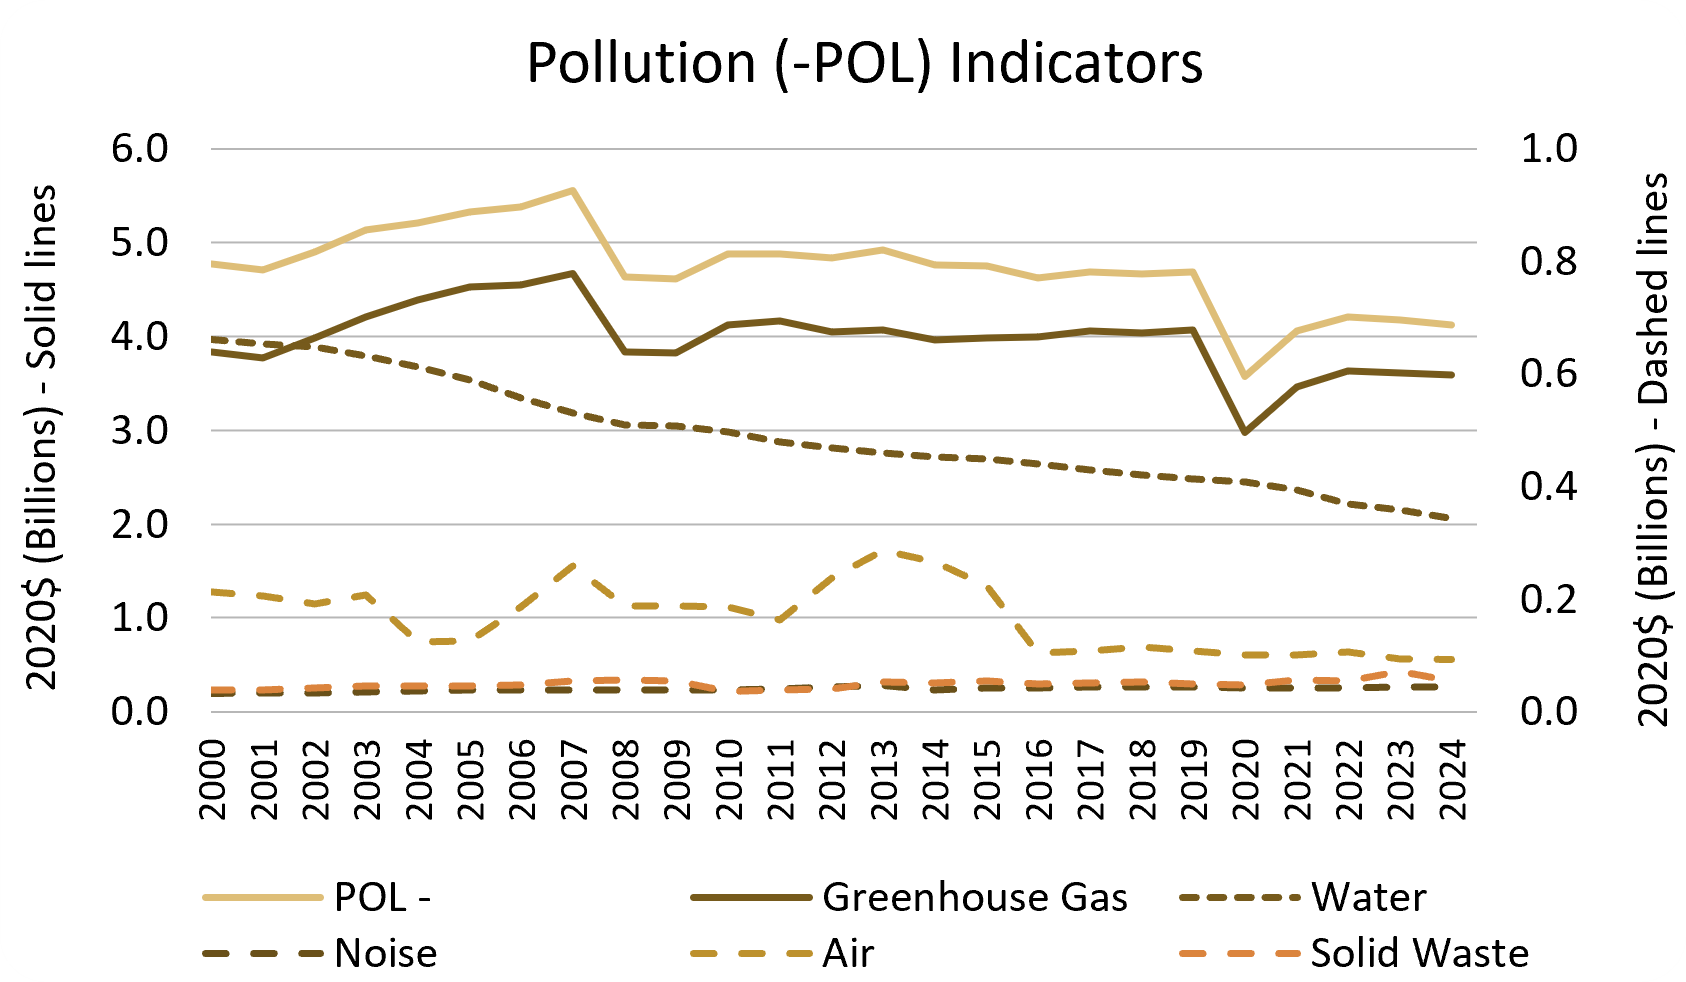
Costs related to the damages from local pollution resulting from economic activity are deducted because they are not welfare enhancing.
Local Pollution Costs (-POL) and POL Sub Indicators Excel Table
Air Pollution
Air pollution stemming from economic activities results in external costs through impacts on human health, damages to ecosystems, etc.; not to be confused with defensive expenditures to control air pollutants in order to avoid/prevent damage (measured within the DEFR sub indicators). Utilizes marginal damage estimates for criteria air pollutants to determine cost of emissions.
The spike in Air pollution during year 2014 was caused by a spike in annual emissions PM2.5 as a result of the 2014-2015 Pāhoa lava flow crisis at Kīlauea Volcano, Hawai‘i.
Greenhouse Gas Pollution
Energy related CO2 emissions contribute to climate change impacts; uses primary energy consumption for selected energy sources in physical units, converted to tons of CO2 and multiplied by marginal damages per ton using the social cost of carbon; note this varies from the other categories in POL (local pollution) because Greenhouse Gas Pollution within GPI incorporates damages both outside of the geographical region and into the future.
The overall drop in Greenhouse Gas Pollution in 2008 stems from changes in the consumption of natural gas and petroleum. In 2008, there was a sharp decrease in petroleum consumption outside the electric power sector (28% decrease in BTU) and a decrease (from .2T BTU to .1T BTU) in natural gas consumption which led to corresponding drop in natural gas consumed outside the electric power sector (because no natural gas is used in electric power sector). At the same time, coal use peaked in 2008. The decline in 2020 was the result of consumption changes during the COVID-19 pandemic, primarily from a decrease in petroleum consumption.
Water Pollution
Water pollution is an externality of economic activity negatively affecting welfare; uses estimates of impaired stream miles, converted to hectares equivalent, and multiplied by value to restore water quality. In lieu of impaired stream miles data, National Fish Habitat Risk Assessment data were used to identify high/very high risk ecosystems per different ecosystem type, converted to hectare equivalents using land cover maps, and multiplied by ecosystem service estimates for similar land cover types. Not to be confused with defensive expenditures to manage wastewater to avoid/prevent damage (in DEFR).
Noise Pollution
Loud and intrusive noises, especially in urban areas, are considered pollution by EPA and regulated under the Clean Air Act; noise pollution causes negative externalities such as lost productivity or sleep disruption. Uses vehicles as a proxy for noise pollution, by combining vehicle miles traveled data with marginal damage cost estimates from the Federal Highway Administration.
Solid Waste Pollution
Municipal solid waste (MSW) is largely an outcome of economic activity and has associated external impacts; multiplies annual volume of local solid waste by an estimate of public external costs for solid waste per ton. Not to be confused with the defensive expenditures associated with managing solid waste to prevent damage (in DEFR).