HI GPI – SOCIAL COSTS
Social Costs (- SC)
GPI = U(PCE_ADJ + PP + KB + KS + KH – SC + KN – POL – DKN)
where PCE_ADJ = (PCE – DEFR – HI – CDE)*INQ
Social Costs (-SC)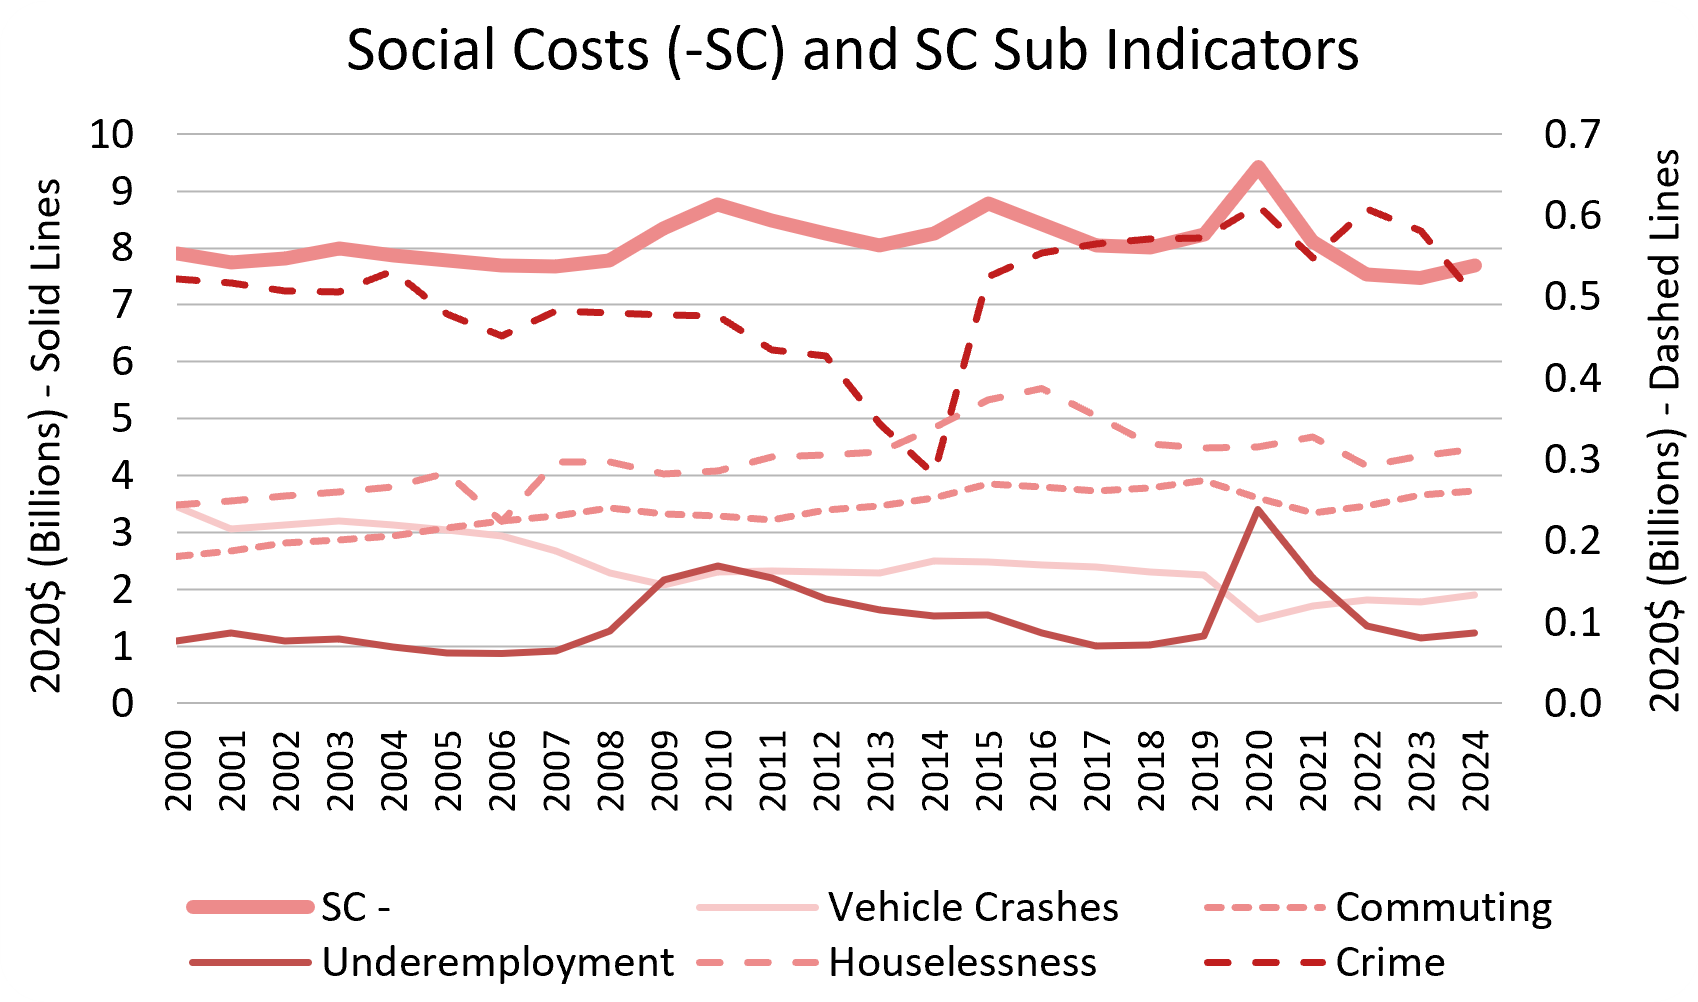
Captures Social Costs (-SC) that result from economic activity but reduce overall welfare, such as homeless/houselessness, underprovided labor hours, commuting time, vehicle crashes, or damage from crimes.
HI GPI and Social Costs Sub Indicators Excel Table
Social Costs Sub Indicators:
Homeless/Houselessness
An undesirable social outcome; multiplies an estimated cost of homeless/houselessness (shelters, public services, health care, etc.) per capita by number of houseless individuals.
Underemployment
Represents the lost welfare when people want to work more but the labor market does not provide opportunities; uses estimates of annual unprovided hours per underemployed worker, underemployment rates, and wage rates.
Jump in Underemployment in year 2020 was the result of the COVID-19 Pandemic.
Crime
Calculates the negative social and economic impacts of crime on individuals and households (e.g., trauma, fear, physical damage) using U.S. Department of Justice estimates of costs per type of crime; assumes that other costs, such as incarceration, are borne by the government.
Vehicle Crashes
Social costs from vehicle accidents can include property damage, lost household production, travel delay, etc. Standard economic measurement systems do not account for motor vehicle crashes as costs; in fact the side effects could be misconstrued as a positive economic gain.
Commuting
Estimates both the direct and indirect expenses of commuting. The direct, or out-of-pocket expenses relate to the money spent to operate a vehicle or for fare on a bus or other public transportation. The indirect costs are associated with loss of time while commuting, time that could have been spent on other, more enjoyable or productive activities.